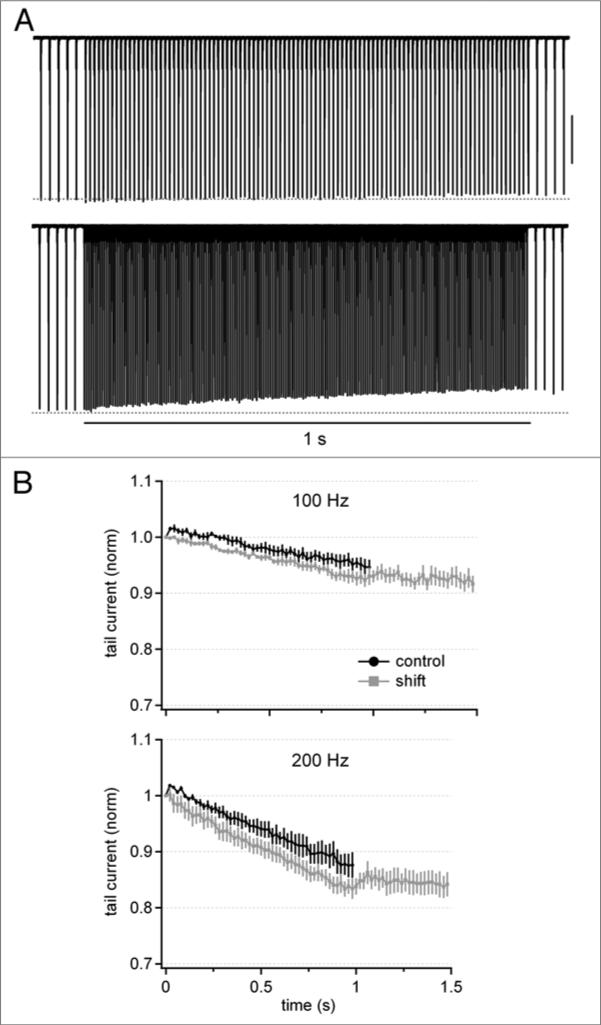
Figure 5.
Ca tail currents during transitions from basal to elevated rates of activation. (A) Cd-sensitive Ca currents (0.5 mM EGTA) elicited by a train of 1-ms pulses at 50 Hz for 500-ms, followed by a shift to 100 Hz (top) or 200 Hz (bottom) for 1 s, followed by a return to 50 Hz for 500 ms. Stimulation periods at 50 Hz are truncated for clarity.(B) Average tail current amplitudes normalized to the first tail current evoked by the initial pulse in the 100-hz or 200-hz train (n = 4), for cells with conditioning at 50 Hz (“shift”) and without conditioning at 50 Hz (“control”). shift and control data are from the same cells.

