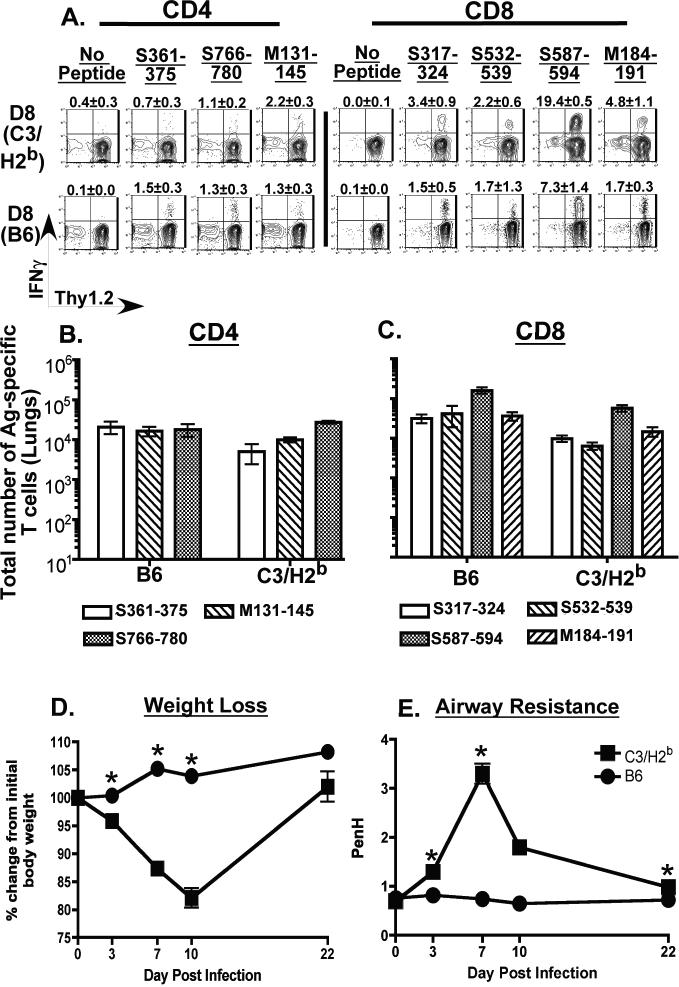
Figure 8. Evaluation of morbidity and antigen-specific T cell responses in the lungs of MHV-1 infected C3.SW-H2b/SnJ mice.
Congenic C3.SW-H2b/SnJ mice that express the H-2b MHC locus were intranasally infected with 5 × 10³ PFU/mouse of MHV-1. Similarly infected wild-type B6 mice were included as controls in the analysis. Antigen-specific CD4 and CD8 T cell responses in the lungs of both groups of mice were evaluated by intracellular cytokine staining on day 8 post infection. (A) Representative contour plots are gated on CD4 or CD8 T cells. Background staining is represented by no-peptide controls. The numerical values above each contour plot depict the frequency of the epitope-specific T cell response. The bar graphs enumerate the total numbers of MHV-1-specific CD4 T cells (B) and CD8 T cells (C) identified in the lungs of MHV-1 infected C3H/HeJ mice. Development of morbidity was monitored by tracking changes in body weight (D) and airway resistance (Penh) (E) at the indicated time points after infection. 10-20 mice per group were evaluated at each time point and statistically significant differences between the mean weights and Penh values of the C3.SW-H2b/SnJ mice and wild-type B6 mice were determined using an unpaired Student's t test and are indicated by an asterisk (*).

