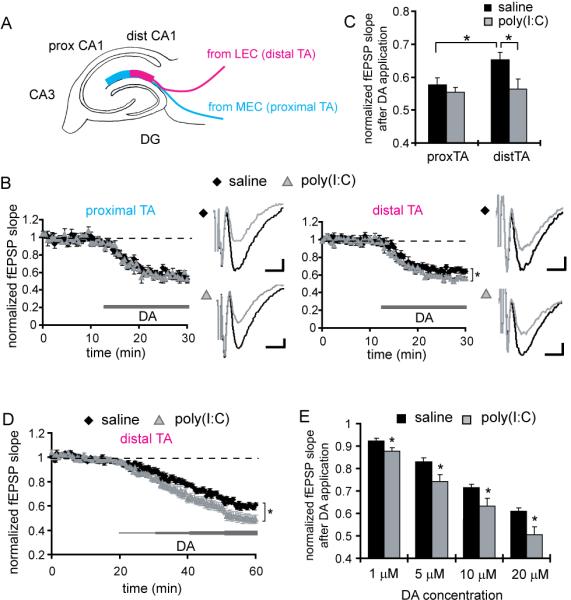
Figure 2. The offspring of poly(I:C)-treated mothers display increased DA-induced depression at distal temporoammonic-CA1 synapses.

(A) A schematic diagram is shown depicting the two distinct axonal projections in the TA pathway from MEC and LEC. (B) Extracellular field recordings are obtained simultaneously from proximal and distal TA-CA1 synapses. For each recording from proximal or distal TA-CA1 synapses, the left panels show the normalized fEPSP slopes from control (black diamonds) and MIA offspring (gray triangles), and the right panels show representative traces of fEPSP waveforms before (black) and after (gray) DA application (scale bar = 0.05 mV, 5 ms). The test pulse was applied every 30 sec and DA (20 μM) was bath applied during the time indicated by the thick line (*p < 0.05 relative to control) (saline: n = 7 slices, poly(I:C): n = 6 slices, 4 pairs of animals). (C) In hippocampal slices prepared from control animals, DA induces a significantly larger depression at proximal compared to distal TA-CA1 synapses. While the slices prepared from MIA offspring show a normal DA-induced depression at proximal synapses, they exhibit a significantly larger depression at distal TA-CA1 synapses, compared to controls (*p < 0.05). (D) Hippocampal slices prepared from MIA offspring show increased DA-induced depression at distal TA-CA1 synapses. The DA concentration was increased every 10 min, from 1 to 20 μM (*p < 0.05 relative to control). (E) Analysis of the data in D is shown. The mean fEPSP slopes at 5–10 min after the application of each designated concentration of DA were analyzed. Slices prepared from MIA offspring show a significantly larger depression at each DA concentration examined (n = 12 slices for each group, 8 pairs of animals) (*p < 0.05 relative to control).
