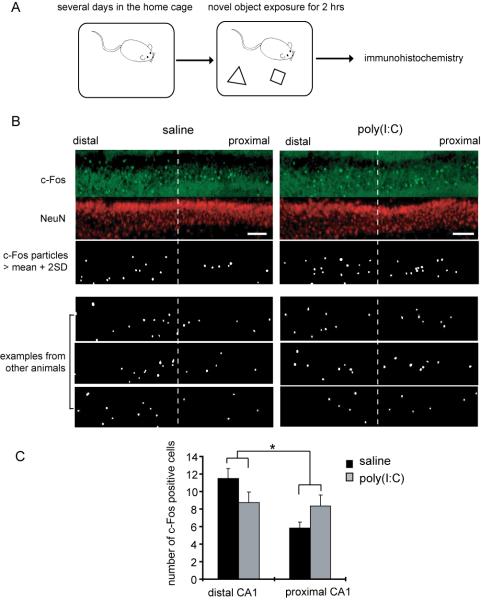
Figure 3. The offspring of poly(I:C)-treated mothers display abnormal c-Fos expression in area CA1 pyramidal neurons following novel object exposure.
(A) A schematic diagram of the behavioral procedure is shown. After mice were accommodated to their new home cages for a few days, two novel objects were placed in the cage. After a 2 hr exposure to allow c-Fos gene activation to be expressed as protein, the hippocampus was processed for immunohistochemistry. (B) Examples of c-Fos expression in the pyramidal layer of area CA1 are shown. The pyramidal layer was divided into equal proximal and distal regions. The c-Fos signals that are larger than the mean + two times the standard deviation, were quantified using ImageJ (see Methods for details) (scale bar = 100 μm). (C) The number of c-Fos signals was quantified in proximal and distal regions of the CA1 pyramidal layer. A two-way ANOVA was performed with 2 variables: animal group (saline vs. poly(I:C)) and CA1 subregion (distal vs. proximal), and revealed a significant interaction (*p < 0.05) (n = 6 pairs of animals, 2 sections analyzed and averaged from each).

