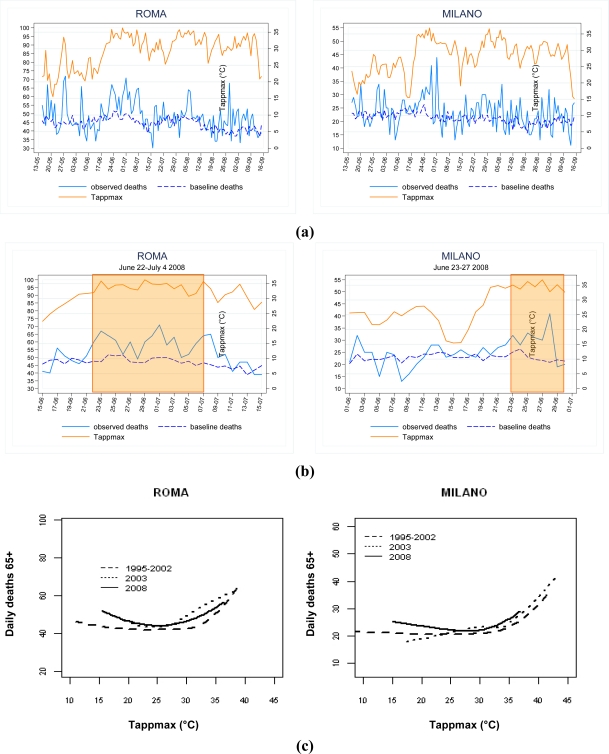
Figure 2.
Evaluation of summer mortality. (a) Daily trend of maximum apparent temperature (Tappmax) and observed and baseline mortality in 65 years and over during summer 2008 in two Italian cities; (b) Daily trend of maximum apparent temperature (Tappmax) and observed and baseline mortality in 65 years and over during heat wave episodes in two Italian cities; (c) Relation between maximum apparent temperature (Tappmax) and mortality in 65 years and over during summer in the reference period, 2003 and 2008 in two Italian cities.

