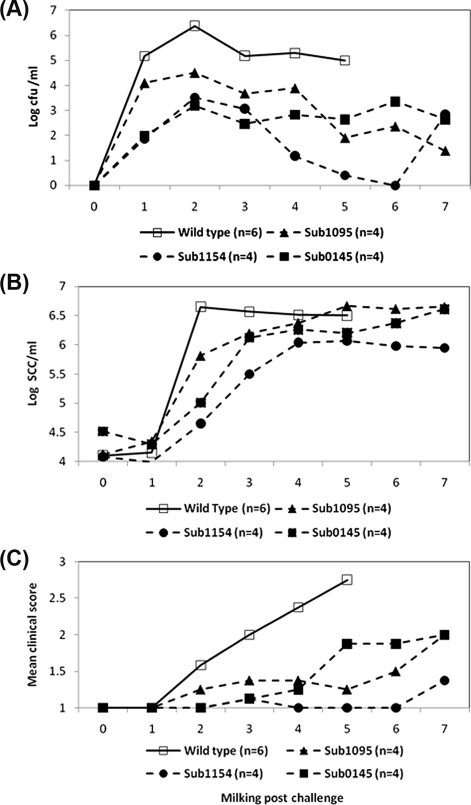
Figure 3.
Bacterial isolation, somatic cell count and clinical response following challenge with S. uberis 0140J and mutants lacking individual SrtA- anchored proteins in dairy cattle. (A) Bacterial recovery of S. uberis at each milking following challenge. Data are represented as the geometric means of the number of bacteria obtained from the milk of animals challenged with either strain 0140J (n = 6) or the individual SrtA-anchored protein mutants (sub1095 n = 4; sub1154 n = 4; sub0145 n = 4), as indicated on the figure. (B) Cellular influx at each milking following challenge. Data are represented by the geometric means of the number of somatic cells obtained from the milk of animals challenged with either strain 0140J (n = 6) or the individual SrtA-anchored protein mutants (sub1095 n = 4; sub1154 n = 4; sub0145 n = 4), as indicated on the figure. (C) Combined clinical scores at each milking following challenge. Data are represented by the mean of the combined clinical scores given for the appearance of the quarter and appearance of the milk, as outlined in Table II with either strain 0140J (n = 6) or the individual SrtA-anchored protein mutants (sub1095 n = 4; sub1154 n = 4; sub0145 n = 4), as indicated on the figure.

