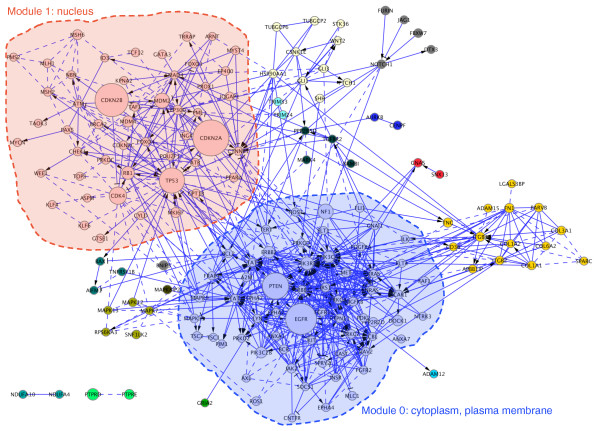
Figure 4.
Edge-betweenness network clustering results for the altered genes from the TCGA data set. Gene nodes in different clusters are displayed in different colors. GO cellular component annotation for clusters 0 and 1 are labeled in the diagram to show the major cellular localizations for genes in these two clusters. The node size is proportional to the number of samples bearing displayed altered genes.

