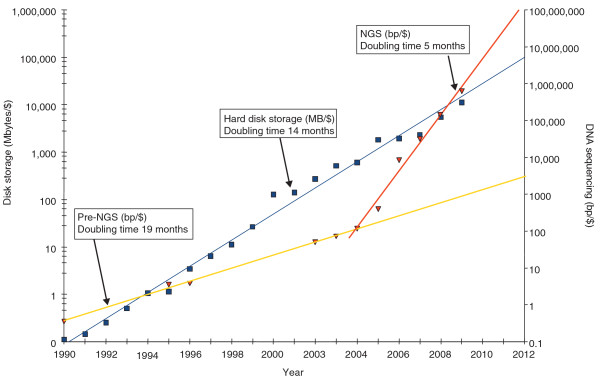
Figure 2.
Historical trends in storage prices versus DNA sequencing costs. The blue squares describe the historic cost of disk prices in megabytes per US dollar. The long-term trend (blue line, which is a straight line here because the plot is logarithmic) shows exponential growth in storage per dollar with a doubling time of roughly 1.5 years. The cost of DNA sequencing, expressed in base pairs per dollar, is shown by the red triangles. It follows an exponential curve (yellow line) with a doubling time slightly slower than disk storage until 2004, when next generation sequencing (NGS) causes an inflection in the curve to a doubling time of less than 6 months (red line). These curves are not corrected for inflation or for the 'fully loaded' cost of sequencing and disk storage, which would include personnel costs, depreciation and overhead.

