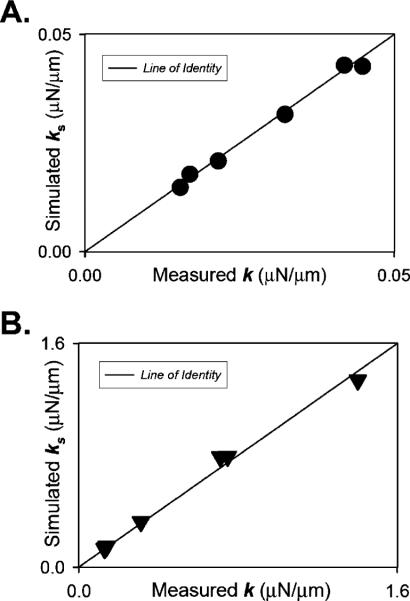
Fig. 3.
Comparison of simulated to experimentally determined stiffness. Shows FEA-modeled stiffness of a sample set of 12 bent microneedles as function of the measured stiffness with low (a; 0.00–0.05-μN/μm range) and high (b; 0.10–1.50-μN/μm range) stiffness. The data clustered closely to the line of identity; on average, the mean error between FEA model and measured stiffness was less than 8%

