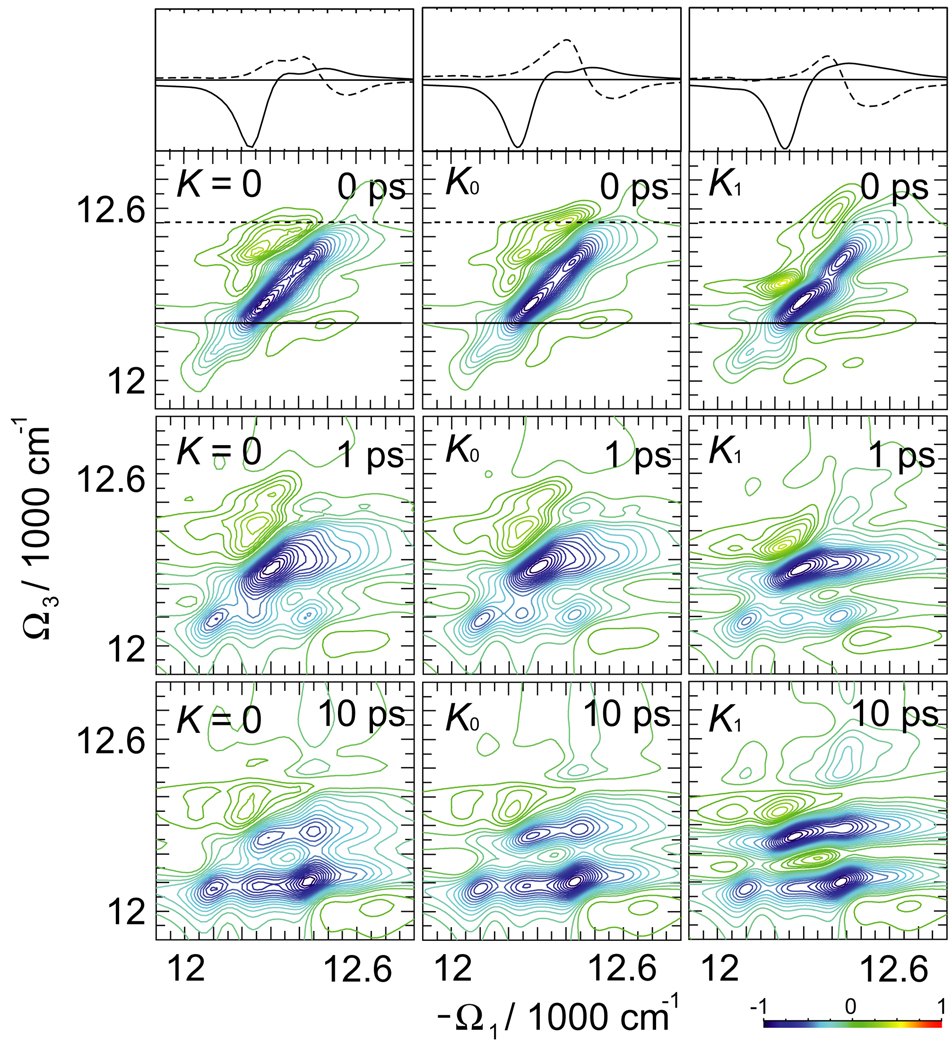
Fig. 3.
Simulated 2D PE signal SkI (Ω3, t2, Ω1) of FMO for different delay times t2 and three sets of K couplings, as indicated. The top traces show the sections of t2 = 0 signal as marked by the black solid and dashed lines in 2D plots. The line-style of the sections corresponds to the marker style in the 2D plots.

