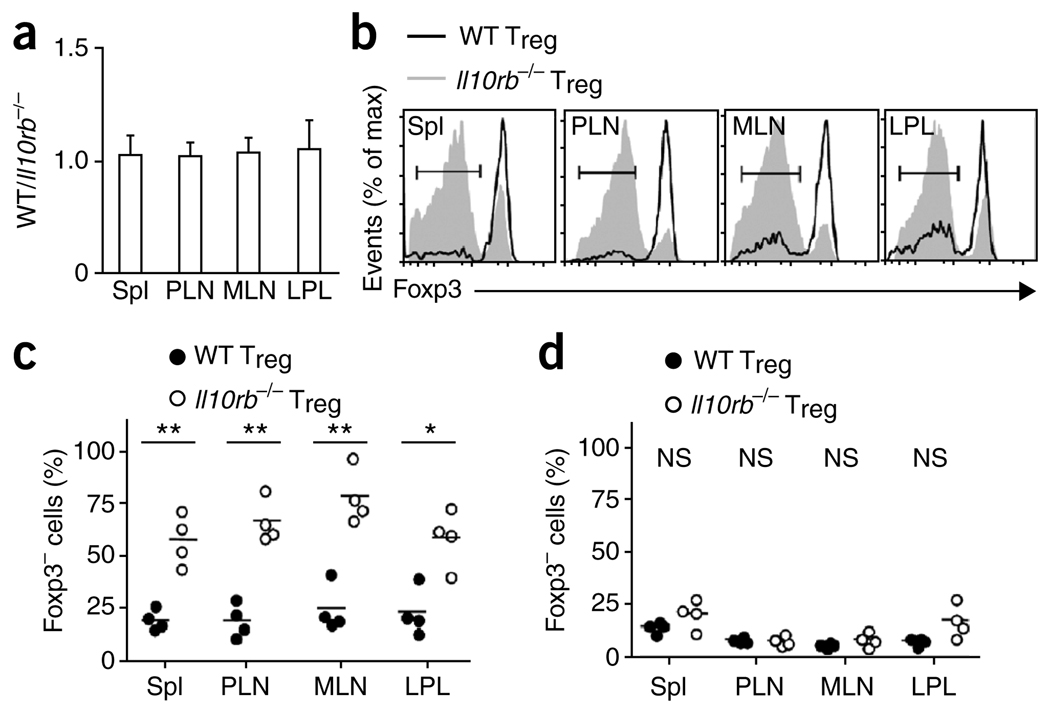
Figure 6.
Foxp3 is lost ‘preferentially’ by Il10rb−/− Treg cells in mice with colitis. (a) Ratio of CD45.1+ to CD45.2+ CD90.1−CD4+TCRβ+ cells isolated from spleen, PLNs, MLNs and LPL of Rag1−/− recipients at 6 weeks after injection of 8 × 10⁵ C57BL/6 (CD90.1+) CD4+CD45RBhi T cells, transferred with 2 × 10⁴ wild-type (CD45.1+) Treg cells and 2 × 10⁴ Il10rb−/− (CD45.2+) Treg cells. Data are pooled from two independent experiments with a total of four mice (mean and s.d.). (b) Flow cytometry of Foxp3 expression by cells isolated from a Rag1−/− recipient mouse as described in a, with gating on CD90.1−CD4+TCRβ+CD45.2− cells (wild-type Treg cells) or CD90.1−CD4+TCRβ+CD45.2+ cells (Il10rb−/− Treg cells). Bracketed lines indicate the Foxp3− population. Data are representative of one of two independent experiments. (c) Foxp3− cells in the CD90.1−CD4+TCRβ+CD45.2− (wild-type Treg) and CD90.1−CD4+TCRβ+CD45.2+ (Il10rb−/− Treg) populations isolated from Rag1−/− mice as described in a. Each symbol represents an individual mouse; small horizontal bars indicate the mean. Data are pooled from two independent experiments with a total of four mice. (d) Foxp3− cells in CD90.1−CD4+TCRβ+CD45.2− (wild-type Treg) or CD90.1−CD4+TCRβ+CD45.2+ (Il10rb−/− Treg) populations isolated from Rag1−/− recipients of 4 × 10⁵ C57BL/6 (CD90.1+) CD4+CD45RBhi T cells, transferred together with 1 × 10⁵ wild-type (CD45.1+) and 1 × 10⁵ Il10rb−/− (CD45.2+) Treg cells. Each symbol represents an individual mouse; small horizontal bars indicate the mean. * P < 0.01; ** P < 0.001 (two-tailed Student’s t-test). Data are pooled from two independent experiments with a total of four mice.

