Figure 7.
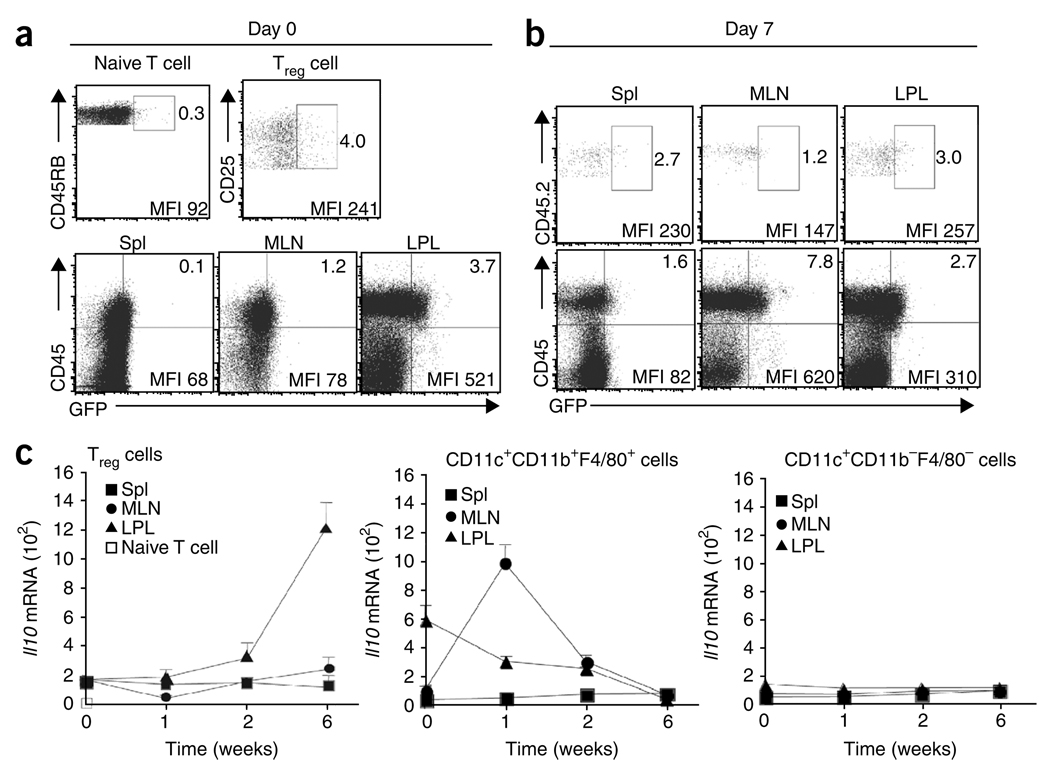
Kinetics of IL-10 expression by Treg cells and host cells. (a) GFP+ cells in IL-10 reporter mice. Numbers adjacent to outlined areas (top row) indicate percent GFP+ cells among gated naive splenocytes (TCRβ+CD4+CD45RBhi) and Treg splenocytes (TCRβ+CD4+CD45RBloCD25+) from Il10gfp mice; numbers in top right quadrants (bottom row) indicate percent CD45+GFP+ cells in tissues from Il10gfpRag1−/− mice. MFI, mean fluorescence intensity. (b) Flow cytometry of GFP+ cells in tissues 7 d after transfer of a mixture of CD45.1+ CD4+CD45RBhi T cells and CD45.2+ Il10gfp Treg cells (ratio, 4:1). Top row, Treg cells gated as CD45.2+ TCRβ+CD4+ cells; bottom row, gated TCRβ−CD4− nonlymphoid cells. Numbers adjacent to outlined areas and in top right quadrants indicate percent GFP+ cells. (c) Real-time PCR analysis of Il10 mRNA in sorted Treg cells (left), CD11b+ cells (middle) and CD11c+ dendritic cells (right) from various sites (keys) before transfer (0) or at 1, 2 and 6 weeks after transfer as in b. Data are from representative one of two independent experiments with six mice (a,b) or are pooled from two independent experiments with six mice (c; mean and s.d.).

