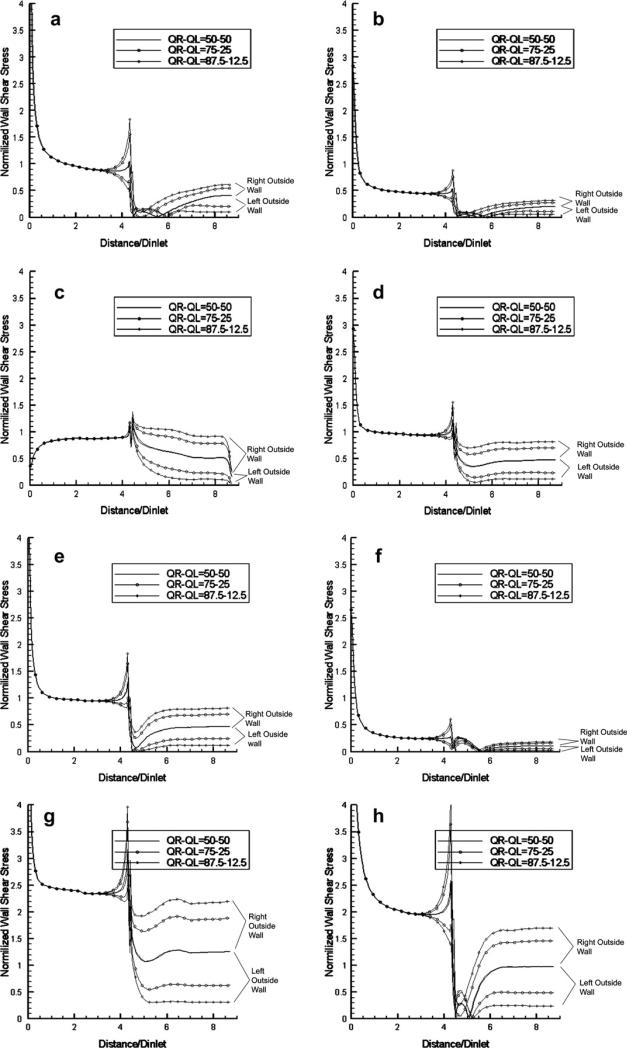
Figure 10.
Normalized WSS distributions at eight pivotal time instants during the cardiac cycle (see Fig. 2) along the left-outside and right-outside wall mid-segments of the bifurcating vessel with 80° angle for three different divisions of volume flow rate (50%–50%, 75%–25%, 87.5%–12.5%) (Newtonian flow model).

