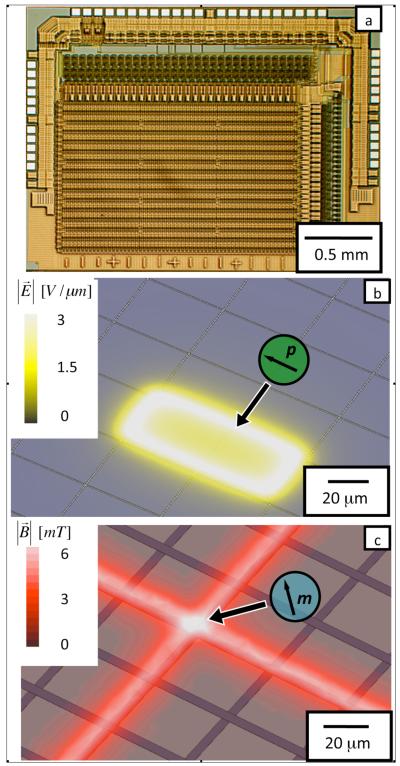
Fig. 1.
a. A micrograph of the integrated circuit. b. The magnitude of the electric field  from a quasi-static electric field simulation is plotted 5 μm above the chip surface. The pixels are shown as blue tiles that cover the surface of the chip. Two pixels are held at 50 V relative to the surrounding pixels. c. The magnitude of the magnetic field
  from simulation is plotted 5 μm above the chip’s surface. The wires are shown as blue stripes running across the surface of the chip. Two wires are sourced with 120 mA and all surrounding wires set to 0 mA.

