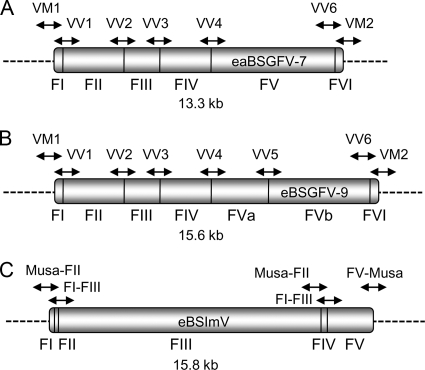
FIG. 1.
Schematic representation of eaBSGFV-7 (A), eBSGFV-9 (B), and eBSImV (C). Horizontal lines indicate junctions between two rearranged viral fragments. Fragments are numbered below eBSVs. Dashed lines represent the flanking Musa genome. Arrows above the fragments show the region amplified by PCR for eBSV detection.

