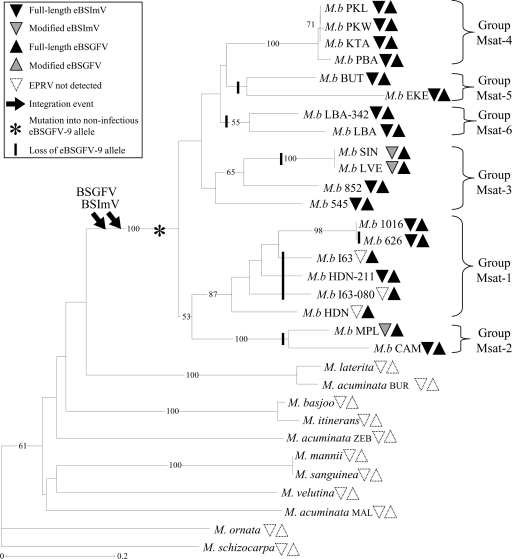
FIG. 3.
NJ tree of wild Musa species, reconstructed from the “Simple Matching” genetic distance from 19 microsatellite loci. Bootstrap values over 50% (percentage from 1,000 replicates) are shown to the left of the nodes. Distribution of eBSVs was investigated with eight PCR markers for eBSGFV and five PCR markers for eBSImV. Full-length eBSVs are represented by black triangles, modified BSVs are represented by shaded triangles, and the absence of eBSV is represented by empty triangles (see Table 1 for details). Downward arrows indicate inferred BSGFV and BSImV integration events. The presumed appearance of the noninfectious eBSGFV-9 allele and its loss in Musa genomes are represented by an asterisk and vertical lines, respectively. The tree was rooted with the Musa ornata sequence.

