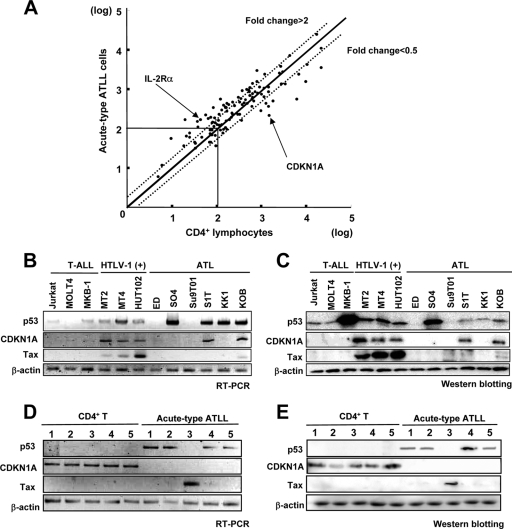
FIG. 1.
Downregulation of CDKN1A in ATLL cells. (A) cDNA microarray analysis of gene expression changes in acute-type ATLL. The scatter plot of DNA microarray signal intensities of ATLL cells from acute-type ATLL patients plotted against the signal intensities of CD4+ T lymphocytes of healthy volunteers is shown. Each dot shows a series of genes which were regulated by HTLV-1 infection (19). The flanking diagonal lines indicate a 2-fold change in expression. Data points (marked with arrows) corresponding to differentially expressed genes IL-2Rα and CDKN1A are also shown. Names of the genes that were regulated by HTLV-1 infection are listed in Table S1 in the supplemental material. (B and C) Expression of mRNA (B) and protein (C) for p53, CDKN1A, and Tax in three HTLV-1-uninfected T-ALL cell lines, three HTLV-1-infected cell lines [HTLV-1 (+)], and six ATLL-derived cell lines was examined by semiquantitative RT-PCR and Western blotting, respectively. The expression of β-actin is shown at the bottom as a control. (D and E) Expression of mRNA (D) and protein (E) for p53, CDKN1A, and Tax in five patients with acute-type ATLL and in five healthy controls (CD4+ T).

