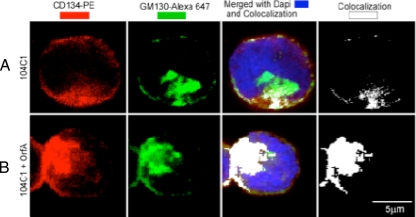
FIG. 7.
Confocal microscopy analysis showing CD134 subcellular localization in 104-C1 and 104-C1-OrfA cells. (A) Confocal imaging of permeabilized 104-C1 cells. (B) The same staining for permeabilized 104-C1-OrfA cells. The panels in the 1st column represent staining for CD134 receptors (red) The panels in the 2nd column represent staining with GM130-Alexa for Golgi complexes (intense red, represented by green). The panels in the 3rd column show nuclear stain with DAPI (4′,6-diamidino-2-phenylindole) (blue) and the colocalization (white) of the two fluorescently labeled reagents. The panels in the 4th column show colocalization only. The results show that significantly more CD134 colocalizes with Golgi complexes in OrfA-expressing cells (B) than in untreated 104-C1 cells (A). PE, phycoerythrin.

