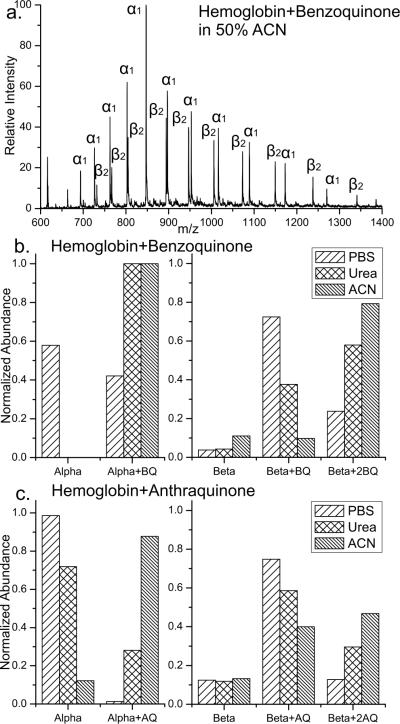
Figure 2.
a) Full mass spectrum for Hemoglobin modified by BQ in 50%ACN, subscripts indicate number of modifications. b) The relative extent of BQ modification of Hemoglobin over all charge states is summarized for three solvent systems: phosphate buffered saline (PBS), 8M urea, and 50% ACN. The x-axis labels indicate the chain and corresponding number of modifications. c) Anthraquinone modifications are shown in plots analogous to those in b).

