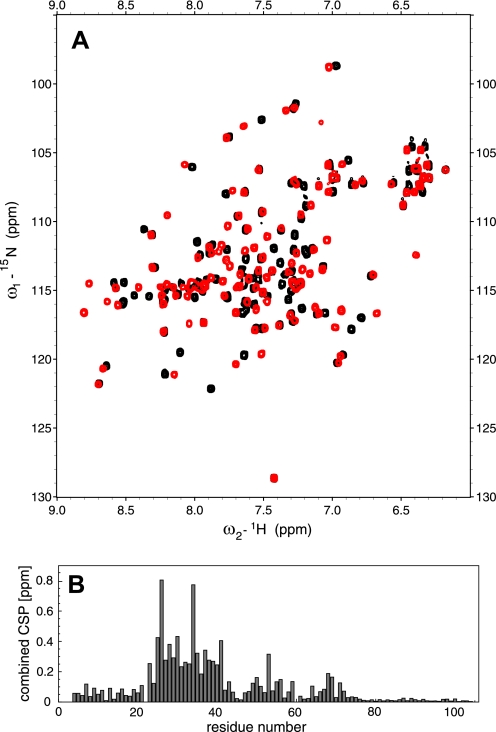
FIGURE 3.
Chemical shift perturbations in Nab2-N upon Gfd1 binding confirm the Gfd1-binding region within Nab2-N. A, 15N-HSQC spectra of Nab2-N in the absence (black) and presence of Gfd1 residues 122–151 (red). The direction of the movement of the most prominently altered signals is indicated by arrows. B, the combined chemical shift perturbation (combined CSP) plotted onto the sequence of Nab2. With the exception of residue Ala53, all perturbations larger than 0.2 ppm are confined to the region between residues Asn23 and Gly41.

