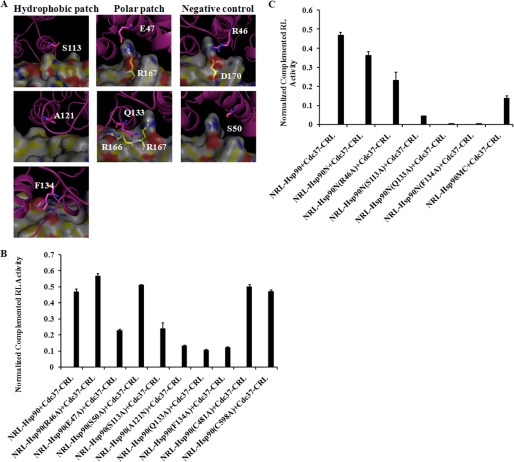
FIGURE 4.
Computational modeling and effect of mutagenesis on Hsp90 residues. A, interface residues of Hsp90-Cdc37 complex. Hsp90 is shown as schematic in pink with Cdc37 in surface representation. Hsp90 residues selected for mutation and polar Cdc37 residues that interact directly are shown in stick representation. B, luciferase assay for NRL-Hsp90 mutations. C, luciferase assay for NRL-Hsp90N mutations. FL was used to normalize the transfection efficiency. Luciferase assay was performed as described under “Experimental Procedures.” Data are presented as mean ± S.D. (n = 3).

