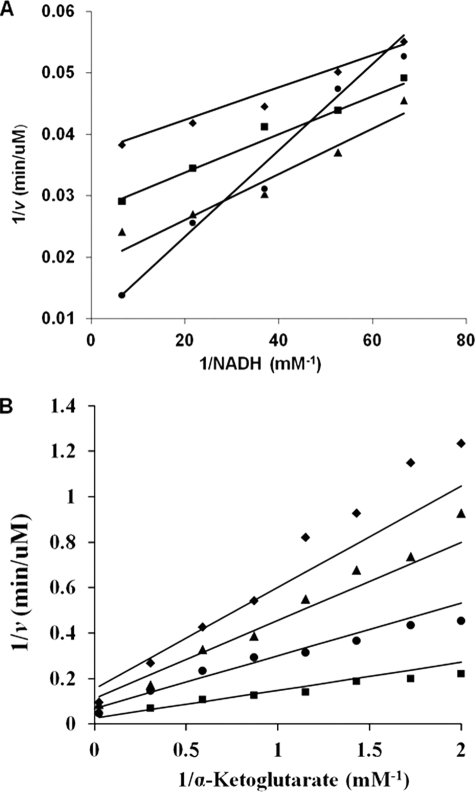
FIGURE 2.
Initial velocity patterns for the E122A and E78A/E122A mutant enzymes. A, double reciprocal plot of initial rate (E122A) as a function of the concentration of NADH, as shown at different fixed levels of lysine: 20 mm (♦), 29.4 mm (■), 52.6 mm (▲), and 300 mm (●). The concentration of α-Kg was fixed at 5 mm (saturation). Data exhibit competitive substrate inhibition by lysine. The points are experimental, whereas the lines are based on a fit to Equation 3. B, double reciprocal plot of initial rate (E78A/E122A), as a function of the concentration of α-Kg as shown at different fixed levels of NADH: 0.025 mm (♦), 0.036 mm (▲), 0.068 mm (●), and 0.54 mm (■). The concentration of Lys was fixed at 1200 mm (saturation). The points are experimental, whereas the lines are based on a fit to Equation 1.

