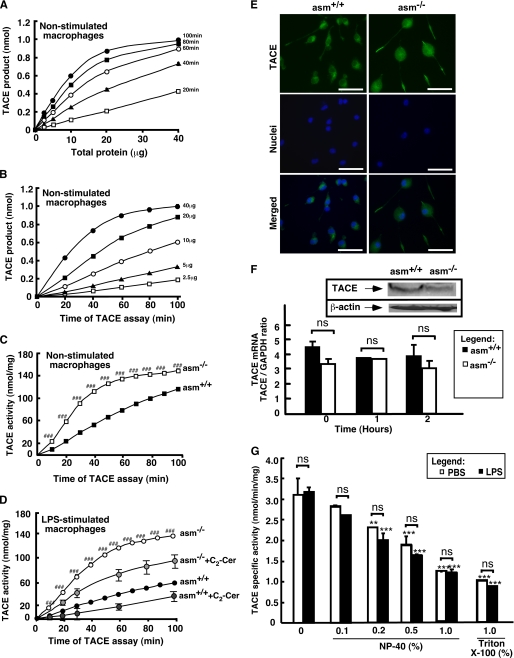
FIGURE 5.
TACE activity, expression, and subcellular localization in asm+/+ and asm−/− cells. A and B, test for linearity of TACE activity assay with protein and time. TACE activity was measured in vitro in detergent-free lysates from RAW264.7 cells. C and D, effect of ASMase deficiency on activity of TACE. asm+/+ and asm−/− macrophages were treated with saline (C) or with a combination of C2-ceramide (Cer) (60 μm) or vehicle (0.1% ethanol) (D). Statistical significance (p < 0.001) of the genotype-based difference in TACE activity is designated ###. TACE activity was measured in detergent-free lysates using fluorigenic substrate, and the fluorescence was monitored over time on a microplate reader. The data are means ± S.D. (n = 3). E, subcellular localization of TACE. TACE was visualized by indirect immunofluorescence in permeabilized asm+/+ and asm−/− macrophages using antibodies against mouse TACE and fluorescent microscopy. Hoechst 33258 was used for staining the nuclei. Scale bar represents 20 μm. F, effect of ASMase deficiency on TACE mRNA and protein expression. TACE mRNA levels were determined by real time PCR in asm+/+ and asm−/−macrophages that were treated with phosphate-buffered saline or LPS for the indicated times. Glyceraldehyde-3-phosphate dehydrogenase (GAPDH) mRNA level was used for normalization. Data are presented as means ± S.E. of three independent experiments. Inset, Western blot analysis in human fibroblasts from healthy individuals or patients with Niemann-Pick disease, type A. β-Actin levels were used to control for uniform loading. G, effect of nonionic detergents on TACE activity. asm+/+ macrophages were treated with LPS (10 ng/ml) (filled bars) or vehicle (open bars) for 4 h. The activity of TACE was measured using fluorigenic substrate and cell lysates (5 μg of protein per assay) in the absence or presence of Nonidet P-40 (NP-40) or Triton X-100 at the indicated concentrations. Data shown are average ± S.D., n = 3. Statistical significance of detergent and LPS effects was determined by two-way ANOVA. Asterisk designates the main effect of detergent (***, p < 0.001; **, p < 0.01), and ns (nonsignificant) refers to the significance of the interaction effect.

