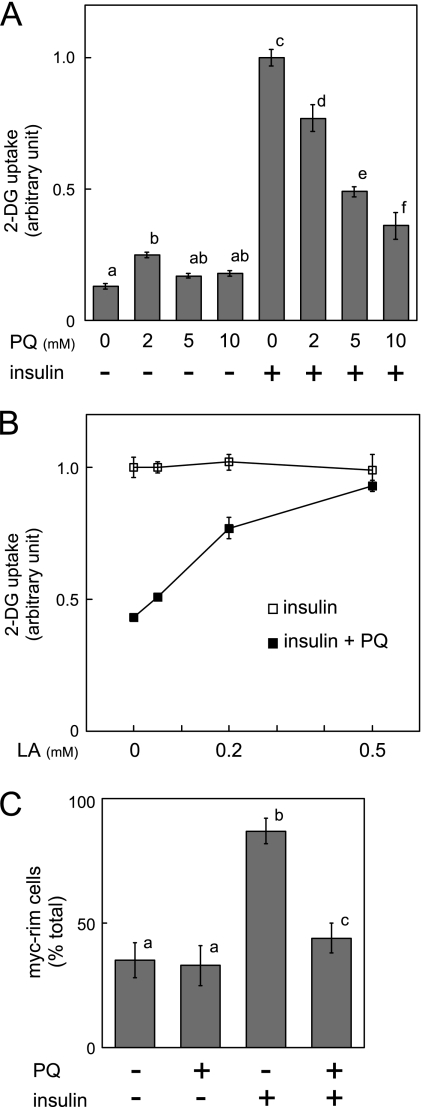
FIGURE 2.
Effect of paraquat on insulin-dependent 2-DG uptake and GLUT4 translocation to plasma membrane. A, 3T3-L1 adipocytes were serum-starved for 18 h, and cells were then treated with indicated concentrations of PQ for 3 h followed by incubation with 10 nm insulin for 20 min. Uptake of 2-DG was then measured as described under “Experimental Procedures.” The experiment was performed in triplicate, and the results shown are the means ± S.E. There are significant differences between values with different superscript characters (p < 0.05). B, 3T3-L1 adipocytes were cultured with serum-free medium containing 0, 50, 200, or 500 μm α-lipoic acid (LA) for 18 h, and cells were then treated with 0 or 10 mm paraquat for 3 h, followed by incubation with 10 nm insulin. Uptake of 2-DG was then measured. The experiment was performed in quadruplicate, and the results shown are the means ± S.E. C, 3T3-L1 adipocytes were electroporated with expression vector containing exofacial Myc-tagged GLUT4-EGFP cDNA. Electroporated 3T3-L1 adipocytes were serum-starved for 18 h, and cells were then treated with 0 or 10 mm paraquat for 3 h followed by incubation with 10 nm insulin for 20 min. GLUT4 translocation to plasma membrane was assayed as described under “Experimental Procedures.” Graph represents the percentage of cells expressing Myc fluorescence on the cell surface. The results shown are the means ± S.E. of three independent experiments. There are significant differences between values with different superscript characters (p < 0.05).

