FIGURE 2.
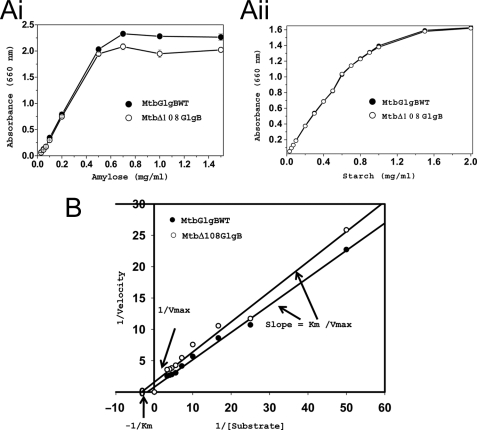
Enzyme assays and kinetic studies. A, substrate utilization curves for MtbGlgBWT and MtbΔ108GlgB proteins with amylose (i) and starch (ii) as substrates. Substrates were prepared in 50 mm citrate buffer, pH 7.0. In a 100-μl reaction mixture, the required amount of substrate was incubated with 1.5 μm purified protein with different concentrations of substrate and incubated at 25 °C for 30 min. The reaction was stopped by adding KI/I2 solution, and absorbance was recorded at 660 nm. B, Lineweaver-Burke plots for MtbGlgBWT and MtbΔ108GlgB. The protein concentration was 0.15 μm, whereas the substrate concentration was varied between 0.02 and 0.3 mg/ml at regular intervals.

