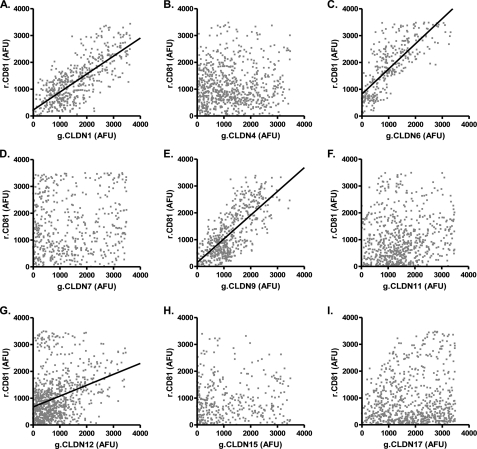
FIGURE 2.
Analysis of CLDN-CD81 interactions. 293T cells were transfected to express DsRED-CD81 (r.CD81) and a panel of AcGFP-tagged CLDN (g.CLDN) constructs (CLDN1–17, panels A–I). Ten cells were imaged as described in Fig. 1, and estimates of r.CD81 association with g.CLDNs were evaluated by regression analysis and summarized in Table 1. The images represent scatter plots closest to the median FIR for each g.CLDN-r.CD81 studied.

