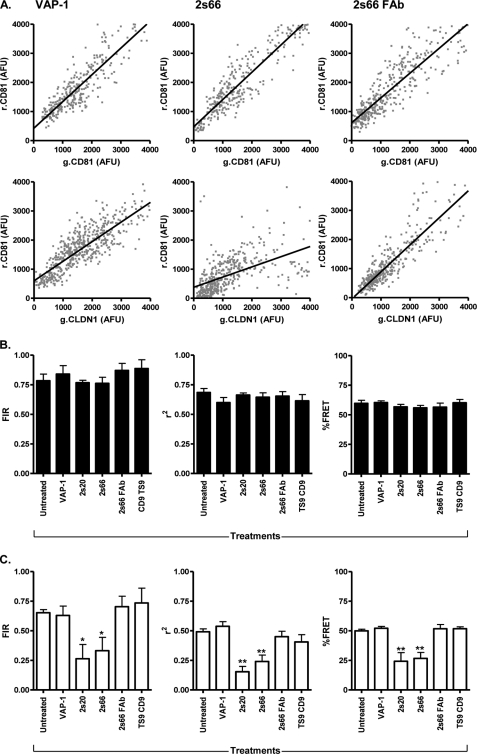
FIGURE 4.
Anti-CD81 modulation of CD81-CD81 and CLDN1-CD81 association(s). 293T cells were transfected to express AcGFP (g) and DsRED (r) fluorescence-tagged g.CD81-r.CD81 or g.CLDN1-r.CD81 and were treated with control anti-VAP1, anti-CD81 mAbs 2s20 and 2s66, 2s66 FAb fragment, and anti-CD9 TS9 at equimolar concentrations (13 μm) for 1 h at 37 °C. Representative g.CD81-r.CD81 and g.CLDN1-r.CD81 scatter plots of transfected cells treated with anti-VAP-1, anti-CD81 2s66 IgG, and FAb are shown (A). The effect of mAb treatments on g.CD81-r.CD81 (B) and g.CLDN1-r.CD81 (C) mean correlation coefficient (r2) and fluorescent intensity ratio (FIR) of ten cells is presented. One way analysis of variance and Dunnett's multiple comparison test were used to determine the degree of significance (*, p < 0.05; **, p < 0.01).

