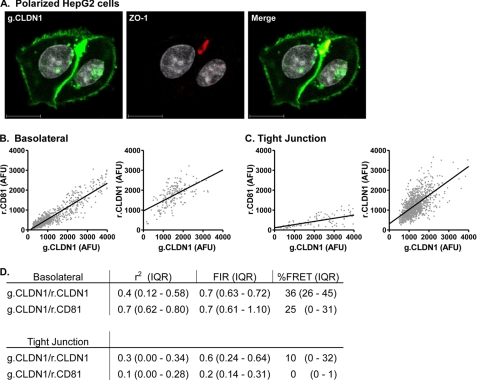
FIGURE 6.
Effect of cell polarization on CLDN1-CD81 and CLDN1-CLDN1 association. HepG2 cells transfected to express AcGFP (g) and DsRED (r) fluorescence-tagged g.CLDN-r.CD81 and g.CLDN1-r.CLDN1 were allowed to polarize over a period of 3 days. Apical bile canalicular structures were identified by staining with anti-ZO-1 and visualized with alexa-633-conjugated secondary anti-rabbit Ig (A). Representative scatter plots of g.CLDN-r.CD81 and g.CLDN1-r.CLDN1 at basolateral (B) and tight junction (C) membrane domains are shown, and the cumulative data from ten cells are summarized below (D).

