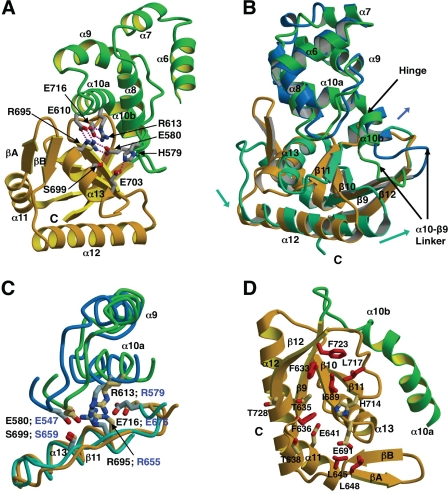
FIGURE 4.
Inter-domain salt bridges and conformational rearrangement in the helical and C-terminal domains of FlhAC. Drawn with Molscript/Raster3D (49, 50). A, ribbon diagram depicting salt bridge interactions between the helical (green) and C-terminal (gold) domains of Hp FlhA. Side chains are shown as ball and stick models with hydrogen bonds drawn as dotted red lines. Salt bridges shown are: Glu-610 (helical) and Arg-695 (C-domain), Arg-613 (helical) and Glu-716 (C-domain), Glu-580 (helical) and Arg-695 (C-domain), His-579 (helical), and Glu-703 (C-domain). B, depiction of the helical and C-terminal domains in H. pylori (colored green and gold) and Salmonella (dark blue and aquamarine) FlhAC structures based on a least squares superposition of the helical domains. Movements of the Salmonella domains relative to H. pylori FlhA are indicated with arrows. C, structural superposition depicting conserved salt bridge residues at the interface of the helical and C-terminal domains of H. pylori and Salmonella FlhAC. Colored as in B. D, ribbon representation showing the side chains of mostly hydrophobic residues making up a conserved surface depression in the H. pylori FlhA C-domain. Side chains are drawn as red ball-and-stick models and labeled accordingly.

