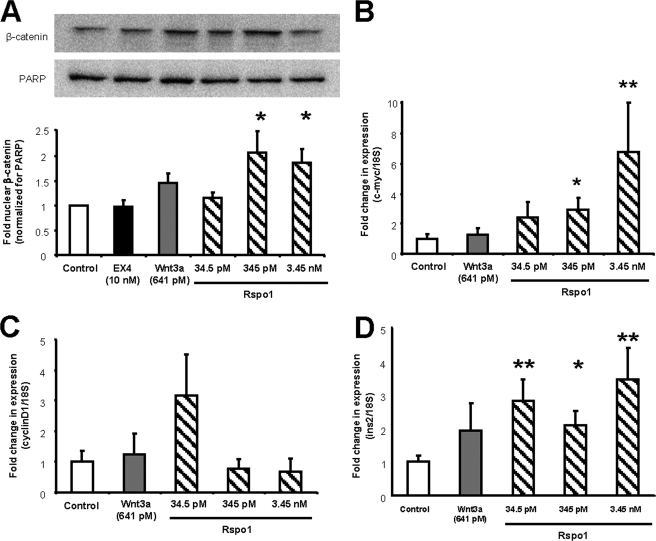
FIGURE 2.
Rspo1 activates cWnt signaling and increases insulin mRNA levels in MIN6 β-cells. A, ratio of nuclear β-catenin to nuclear PARP in MIN6 cells treated with EX4, Wnt3a, and increasing doses of Rspo1 for 30 min. A representative blot is shown. All values are expressed as fold-relative to the control (medium alone, n = 4–6). B–D, relative expression analysis of c-myc (B), cyclin D1 (C), and insulin (D) mRNA levels by qRT-PCR in MIN6 β-cells treated with medium alone (control), Wnt3a, or increasing doses of Rspo1 for 12 h. Data were normalized to the housekeeping gene 18 S rRNA (n = 9–11) and are displayed relative to vehicle-treated controls. *, p < 0.05 and **, p < 0.01.

