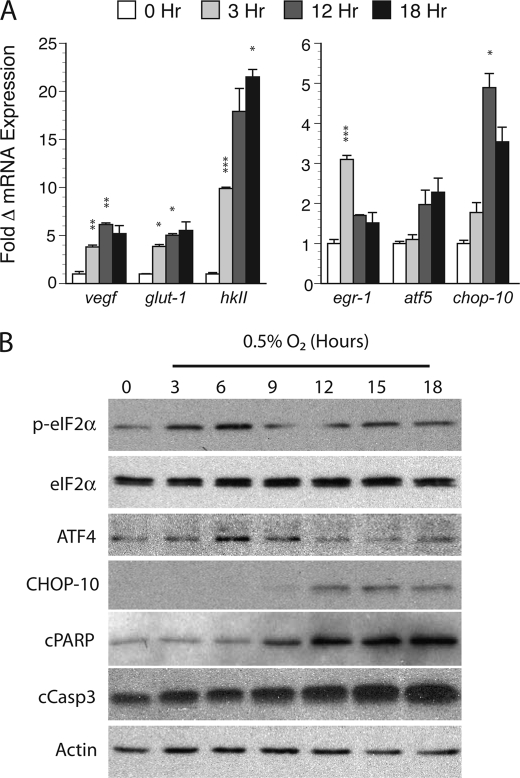
FIGURE 2.
Validation of gene expression in hypoxic cortical neuron cultures. A, quantitative PCR validation of hypoxia-induced microarray targets. RNA prepared from normoxic controls (0 h) or samples exposed to between 3 and 18 h of hypoxia (0.5% O2) was subjected qPCR for the targets vegf, glut-1, hkII, egr-1, atf5, and chop-10. The -fold change in mRNA expression (average ± S.D.) relative to normoxic controls using the ΔΔCT method is shown with significance measured by Student's t testing (*, p < 0.05; **, p < 0.01; and ***, p < 0.005; hypoxic versus paired normoxic controls). B, hypoxia activates ER stress and apoptotic targets in cortical cultures exposed to continuous hypoxia (0.5% O2). Samples were analyzed at the indicated times by Western blotting for the following targets: phosphorylated and total eIF2α (p-eIF2α), ATF4, CHOP-10, cleaved PARP (cPARP), cleaved caspase-3 (cCasp3), and actin.

