FIGURE 2.
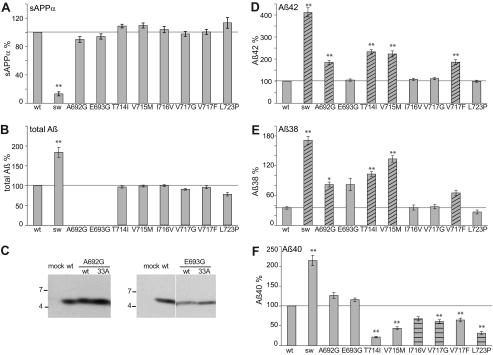
Analysis of APP-FAD mutations. Quantification of secreted sAPPα, total Aβ, Aβ42, Aβ40, and Aβ38. A, sAPPα levels, APP-wt (without FAD) set as 100% (mean ± S.E., n = 5–16). B, total secreted Aβ levels, APP-wt set as 100% (mean ± S.E., n = 6–14). Note that A692G and E693G could not be analyzed by total Aβ ELISA as the FAD mutations alter the epitope of the antibody 4G8. C, total Aβ levels of A692G and E693G were analyzed by immunoprecipitation with antibody 18-1 and Western blot analysis with W0-2. D, Aβ42 levels, APP-wt set as 100% (mean ± S.E., n = 5–17). E, Aβ38 levels, APP-G33A set as 100%, see supplemental Fig. S1C and (mean ± S.E., n = 4–12). F, Aβ40 levels, APP-wt set as 100% (mean ± S.E., n = 7–16). A–E, asterisks indicate significant differences to APP-wt (*, p < 0.01, **, p < 0.001, one-way ANOVA type Dunnett). Shaded bars indicate mutations increasing Aβ42 and Aβ38. Horizontal shaded bars highlight mutations only decreasing Aβ40. Horizontal lines mark the fragment levels of APP-wt for better comparison with the mutants.

