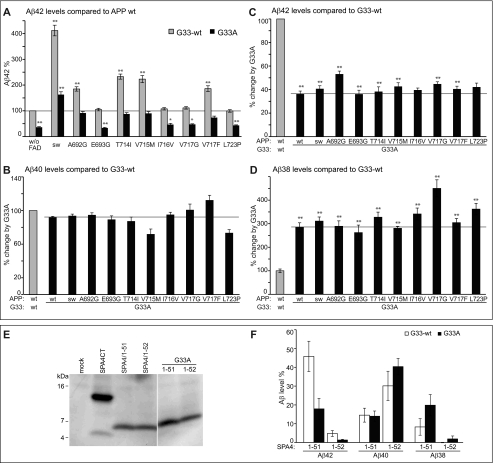
FIGURE 3.
Impact of the APP-GxxxG mutation G33A on APP-FAD processing. A, Aβ42 levels; APP-wt was set as 100% (mean ± S.E., n = 5–17). For better comparison, bars of APP-FAD mutations as in Fig. 2D are shown (G33-wt, gray bars). The mutation G33A leads to a relative decrease in Aβ42 levels (black bars). Asterisks indicate significant differences to APP-wt (*, p < 0.01, **, p < 0.001, one-way ANOVA type Dunnett). The horizontal line marks Aβ42 level of APP-wt for better comparison. Original data of sAPPα, total Aβ, Aβ40, and Aβ38 ELISA are shown in supplemental Fig. S1. B–D, Aβ levels of the G33A constructs (black bars) normalized to the respective Gly33-wt constructs, which were set as 100% (represented by gray bars). Asterisks indicate significant differences to the respective Gly33-wt construct (**, p < 0.001, one-way ANOVA type Bonferroni). B, relative Aβ40 levels (mean ± S.E., n = 7–16). C, relative Aβ42 levels (mean ± S.E., n = 5–17). D, relative Aβ38 levels (mean ± S.E., n = 4–12). B–D, horizontal lines mark the fragment levels of APP-G33A for better comparison with the FAD mutants. E, analysis of expression levels of SPA4CT-related constructs in SH-SY5Y cells. The fragments show comparable expression levels, although these are generally lower than for SPA4CT-wt. Western blot was stained with monoclonal W0-2. F, levels of secreted Aβ from SPA4-fragments are normalized to SPA4CT-wt, which was set as 100% (mean ± S.E., n = 3–9). The mutation G33A has no impact on Aβ40 levels but decreases Aβ42 and increases Aβ38 levels. w/o, without.

