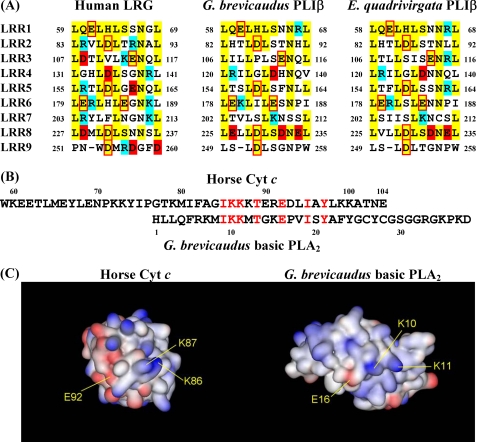
FIGURE 5.
Sequence comparison between LRG and PLIβ on the concave surface of LRR structures and sequence homology between Cyt c and PLA2. A, sequence comparison between LRG and PLIβ on the concave surface of LRR structures. The residues conserved among these proteins are shown in yellow. The residues with negative and positive charges are in red and blue, respectively. Conserved residues with negative charges are in red boxes. B, sequence homology found between the C-terminal region of horse Cyt c and the N-terminal region of G. brevicaudus basic PLA2. C, solid molecular surfaces of Cyt c (PDB ID: 1HRC) and basic PLA2 (PDB ID: 1B4W) colored by charge (blue, positive charge; red, negative charge).

