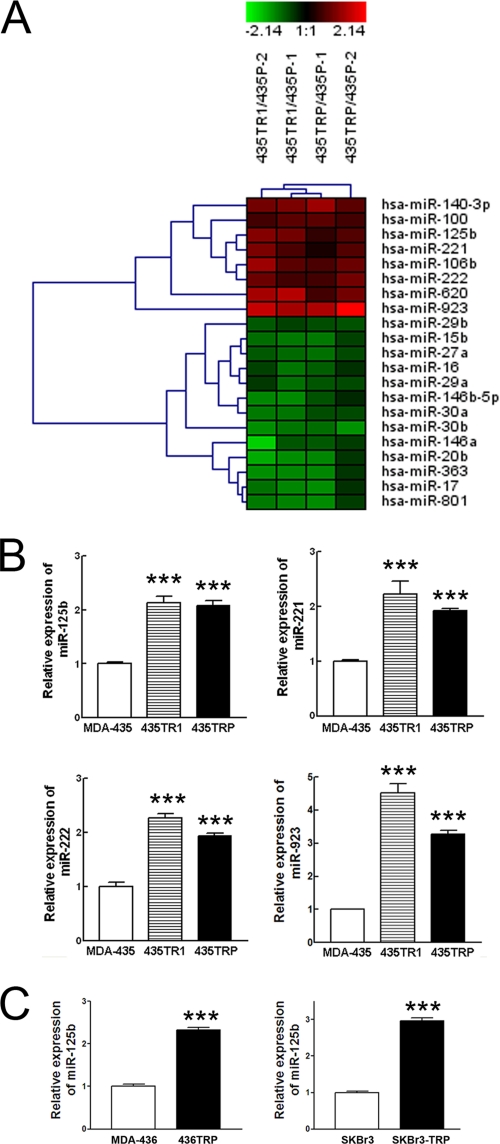
FIGURE 1.
Profiles of miRNAs in Taxol-sensitive and -resistant cancer cells. A, shown is a Heatmap of a total of 21 miRNAs that were significantly up-regulated (n = 8) or down-regulated (n = 13) in Taxol-resistant 435TR1 and 435TRP cells compared with those in their parental MDA-435 cells (p < 0.05), which are listed in supplemental Table S1. Heatmap colors represent relative signal ratio of miRNA expression between Taxol-resistant 435TR1 or 435TRP to their parental MDA-435 cells as indicated in the color key for each panel. The expression ratio values for a given sample group of interest were summarized by their mean. Rows, miRNAs; columns, signal ratio of miRNA expression of Taxol-resistant cells to their parental cells. For each miRNA the red color means an expression of miRNA in Taxol-resistant cells higher than their parental cells, and the green color means a lower expression value. B, qRT-PCR was performed to validate the expression of miR-125b, miR-221, miR-222, and miR-923 in Taxol-resistant 435TR1 and 435TRP and their parental MDA-435 cells. RNU6B was used as an internal control and for normalization of the data. C, qRT-PCR was performed to validate the expression of miR-125b in Taxol-resistant 436TRP and SKBr3-TRP and their parental MDA-436 and SKBr3 cells. RNU6B was used as an internal control and for normalization of the data. Columns, mean of three independent experiments; bars, S.E. ***, p < 0.001.

