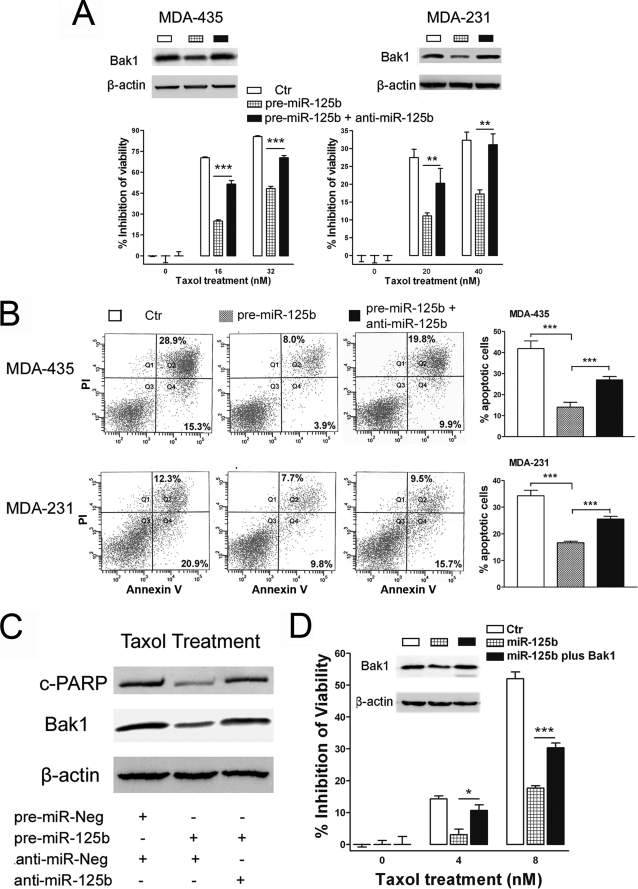
FIGURE 6.
Restoring the expression of Bak1 recovers Taxol sensitivity. A, MDA-435 (left) and MDA-231 (right) cells were co-transfected with pre-miR-125b alone or in combination with anti-miR-125b. Western blotting was performed to detect the expression of Bak1 (top). β-Actin was used as a loading control (Ctr). MDA-435 and MDA-231 cells with transfection of pre-miR-125b alone or in combination with anti-miR-125b were seeded into 96-well plate at the density of 8 × 10³ per well and then treated with the indicated concentrations of Taxol for 48 h. The cell viability was detected. Data are presented as the percentage of viability inhibition measured in cells treated wi3thout Taxol. Columns, mean of three independent experiments; bars, S.E. *, p < 0.05, **, p < 0.01, ***, p < 0.001. B, MDA-435 or MDA-231 cells were transfected with 100 nm pre-miR-125b alone or in combination with 100 nm anti-miR-125b, and then the transfected cells were treated with 8 or 40 nm Taxol for 48 h. Then the cells were collected for apoptosis analysis by annexin V staining and flow cytometry. Percentages of apoptotic cells are represented in bar diagram from three independent experiments (right). C, MDA-435 cells were transfected with 100 nm pre-miR-Neg plus anti-miR-Neg (Ctr), pre-miR-125b plus anti-miR-Neg, or pre-miR-125b plus anti-miR-125b; 24 h after transfection, cells were treated with 20 nm Taxol for 48 h. Cell lysates were prepared for Western blotting using antibodies against cleaved PARP (top) or Bak1 (middle). β-Actin was used as a loading control (bottom). D, MDA-435 and MDA-231 cells were co-transfected with 100 nm pre-miR-125b alone or in combination with 4 μg of pIRES2-EGFP/Bak1 or pIRES2-EGFP. Western blotting was performed to detect the expression of Bak1 (inset). β-Actin was used as a loading control. The transfected MDA-435 were seeded into a 96-well plate at the density of 8 × 10³ per well and then treated with 0, 4, and 8 nm Taxol for 48 h. The cell viability was detected. Data are presented as the percentage of viability inhibition measured in cells treated without Taxol. Columns, mean of three independent experiments; bars, S.E. *, p < 0.05, **, p < 0.01, ***, p < 0.001.

