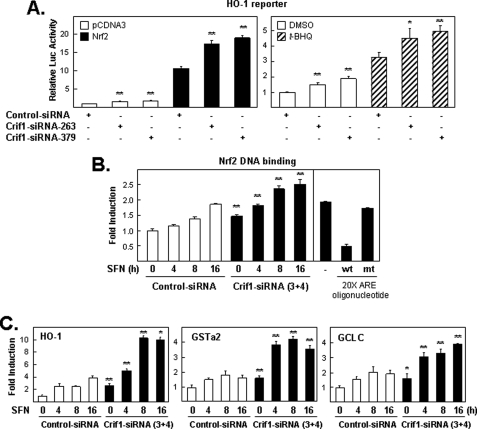
FIGURE 7.
Knockdown of CRIF1 on NRF2-, t-BHQ-, or SFN-induced gene expression. A, endogenous CRIF1 levels limit the ability of the HO-1 reporter plasmid to respond to inducing treatments. Cells pretreated with siRNA (control, CRIF1–263, or -379) for 48 h were transfected with the DNA plasmid as indicated for 16 h and harvested for luciferase (Luc) analysis (left-hand bar graph). Next, cells were transfected similarly as in the left panel (but without NRF2) and then exposed for an additional 24 h to either DMSO or 100 μm of t-BHQ before measuring the luciferase activity (right-hand bar graph). The luciferase activities in all figures were normalized to the value obtained with the empty expression plasmid control, unless otherwise indicated or as described under “Experimental Procedures,” and are presented as mean luciferase activity ± S.E. of n = 4 wells. A representative of three independent experiments that yielded similar results is shown in each panel. * means p < 0.05, and ** means p < 0.005. B, NRF2 binds to an ARE-containing DNA sequence. Nuclear extracts from cells treated with siRNA (control versus CRIF1–3 and -4) for 48 h and treated with SFN (5 μm) for the indicated times were incubated with TransAMTM-NRF2, a quantitative ELISA kit. The left-hand panel shows the effect of CRIF1-siRNA treatment on total nuclear binding capacity of NRF2. The right-hand panel demonstrated the effects of 20-fold excess amount (20 pmol/well over 1 pmol-the amount of probe immobilized on the plate) of wild-type consensus oligonucleotides or the mutated consensus oligonucleotides on NRF2 binding activity in SFN-treated sample (5 μm, 16 h). mt, mutant; wt, wild type. C, total RNA isolated from experiments similar to that performed in B was used for quantitative real time PCR analysis. Appropriate primers for the three NRF2 target genes, HO-1, GSTa2, and GCLC, were used as described under “Experimental Procedures.”

