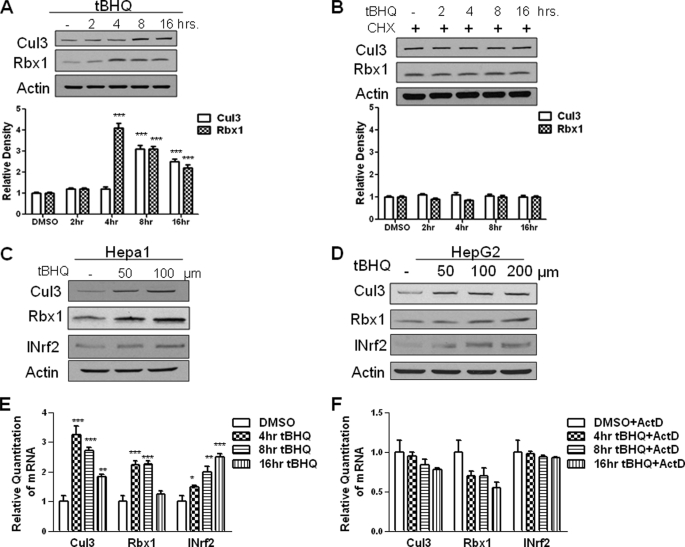
FIGURE 1.
Antioxidant t-BHQ induces INrf2 gene expression. A, Western analysis of Cul3 and Rbx1 expression in Hepa-1 cells. Hepa-1 cells were grown in a monolayer and treated with 100 μm t-BHQ for the indicated time intervals. Total cell lysate was analyzed with anti-Cul3 and Rbx1 antibodies. β-Actin was used as a loading control. Densitometry measurements of bands were quantitated and shown in graph blots below. B, Western analysis of Cul3 and Rbx1 protein in Hepa-1 cells. Total cell lysate was treated with 100 μm t-BHQ and 30 μg/ml cycloheximide (CHX) for the indicated time intervals and were analyzed for Cul3 and Rbx1 expression by Western blotting and probing with anti-Cul3 and Rbx1 antibody. β-Actin was used as a loading control. C and D, Hepa-1 and HepG2 cells were seeded in a monolayer and treated with 50, 100, and 200 μm t-BHQ for 16 h. Cells were then lysed and lysate was probed with anti-Cul3 and anti-Rbx1 antibodies. Anti-INrf2 was used as a positive control and β-actin was used as a loading control. E, Hepa-1 cells were seeded in a monolayer and treated with 100 μm t-BHQ for varying time points. Cells were lysed, and RNA was extracted and converted to cDNA. 50 ng of cDNA was mixed with 1× Taqman master mix and either Cul3, Rbx1, or INrf2 primers and probes and GusB primers and probes as control. Relative quantitation of mRNA was measured and plotted. F, in a similar experiment, Hepa-1 cells were seeded and were pretreated with 2 μg/ml actinomycin D (ActD) for 2 h followed by 100 μm t-BHQ + actinomycin D for the indicated time interval. RNA was extracted and converted to cDNA. 50 ng of cDNA was mixed with 1× Taqman master mix and either Cul3, Rbx1, or INrf2 primers and probes and GusB primers and probes as control. Relative quantitation of mRNA was measured and plotted. All experiments were repeated 3–5 times. The representative results are shown.

