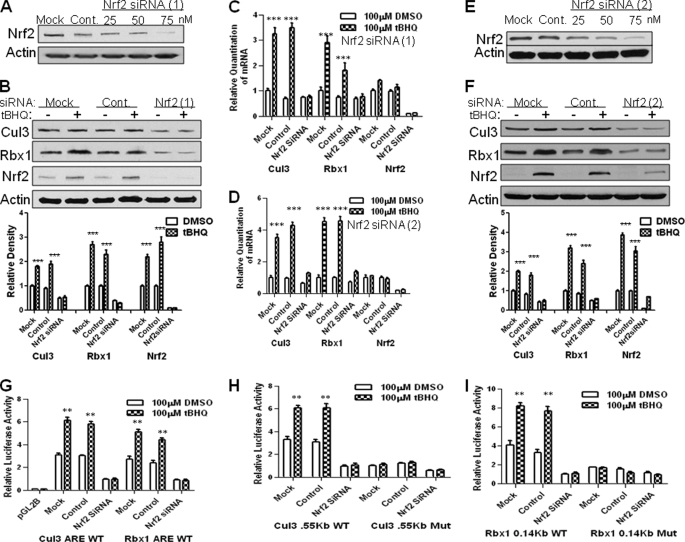
FIGURE 6.
siRNA inhibition of Nrf2 decreases t-BHQ-inducible expression of Cul3 and Rbx1. A, Hepa-1 cells were transfected with control, 25, 50, or 75 nm of Nrf2 siRNA. Forty-eight hours after transfection, cells were harvested, lysed, and immunoblotted with anti-Nrf2 and actin antibodies. B, real time-PCR analysis of Hepa-1 cells transfected with control or Nrf2 siRNA. Twenty-four hours after siRNA transfection, cells were treated with 100 μm DMSO or t-BHQ. Cells were then harvested and total RNA was extracted and converted to cDNA. 50 ng of cDNA was analyzed for mRNA levels using Cul3 and Rbx1 primers and probes. Nrf2 was also probed for control. C, Western analysis of Cul3 and Rbx1 expression with Nrf2 siRNA. Hepa-1 cells were seeded and transfected with control or 75 nm of Nrf2 siRNA. Forty-eight hours after transfection, cells were harvested, lysed, and immunoblotted with anti-Cul3, anti-Rbx1, and anti-Nrf2 and anti-actin antibodies. Densitometry measurements of bands were quantitated and shown in graph blots to the right. D–F, A–C were repeated exactly as previously stated except with a different Nrf2 siRNA, the second Nrf2 siRNA will be referred to in the figures as Nrf2 siRNA (2). G–I, Hepa-1 cells were transfected with control or Nrf2 siRNA. Twenty-four hours after transfection, cells were transfected with Cul3 and Rbx1 promoters or Cul3 and Rbx1 WT and Mut. AREs. Cells were incubated for 16 h in the presence of DMSO or t-BHQ (100 μm). Transfected cells were harvested and analyzed for luciferase activity. The experiments were repeated three times, and the representative results are shown.

