FIGURE 1.
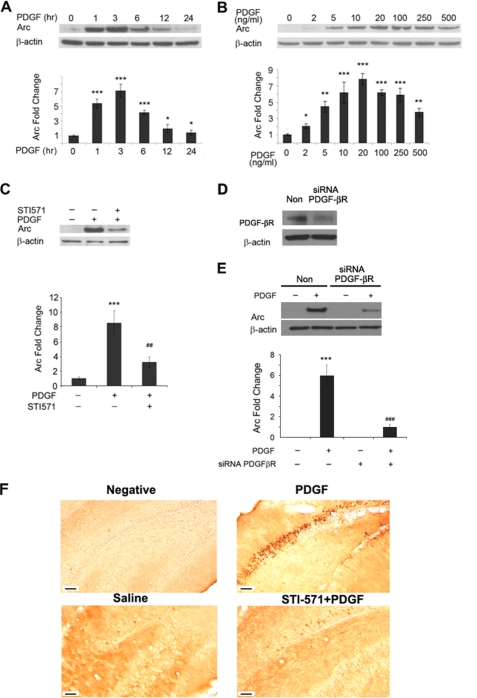
Time-course and dose-curve of PDGF-induced Arc expression in hippocampal neurons. A, the time course of PDGF-induced Arc expression in rat hippocampal neurons is shown. Arc expression reached peak 2–3 h post-PDGF treatment. *, p < 0.05; ***, p < 0.001 versus control group. B, shown is the dose-curve of PDGF-induced Arc expression 3 h post-treatment demonstrating that PDGF even at a concentration of 5 ng/ml was able to induce robust expression of Arc in rat hippocampal neurons. *, p < 0.05; **, p < 0.01; ***, p < 0.001 versus control group. C, pretreatment of neurons with tyrosine kinase inhibitor-STI-571 was able to abrogate PDGF-induced Arc expression. ***, p < 0.001 versus control group; ##, p < 0.01 versus PDGF (20 ng/ml) group. D, Western blot analysis is shown of whole cell lysates from SH-SY5Y cells transfected with either PDGF-βR or nonsense (Non) siRNA using antibodies specific for PDGF-βR. E, transfection of SH-SY5Y cells with siRNAs specific for PDGF-βR abolished PDGF-mediated Arc expression. ***, p < 0.001 versus control group; ###, p < 0.001 versus PDGF (20 ng/ml) group. A representative immunoblot and the densitometric analysis from four separate experiments is presented. F, shown is PDGF-induced Arc expression in vivo. Adult mice were injected with either saline, PDGF, or STI-571 followed by PDGF, and 3 h later the animals were perfused and decapitated. Hippocampal sections were immunostained using the Arc antibody. Saline-injected animals demonstrated very low levels of Arc expression (bottom left panel). PDGF injections resulted in robust Arc expression in the hippocampus (top right panel). The right panels indicate higher magnifications of the boxed area in two respective pictures respectively. Scale bars indicate 50 μm. All the images are representative of three independent experiments.

