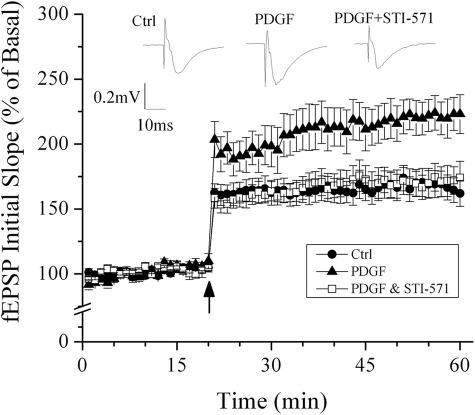
FIGURE 2.
Time course and average magnitude of long term potentiation recorded in the Schaffer-collateral to CA1 synapses from control slices (●), slices treated with PDGF (▴), and slices treated with PDGF+STI-571 (□). The graph plots the initial slope of the evoked EPSPs recorded from the CA1 dendrite field (stratum radium) in response to constant current stimuli. High frequency stimulation (100 Hz, 500 ms ×2) was delivered at the time indicated by an arrow. Note that PDGF induced an enhancement of long term potentiation and the blockade of PDGF-induced enhancement of long term potentiation by STI-571, Representative field EPSPs (fEPSPs) recorded from slices of control, treated with PDGF, and treated with PDGF+STI-571 are shown at the top of the figure. Ctrl, control.

