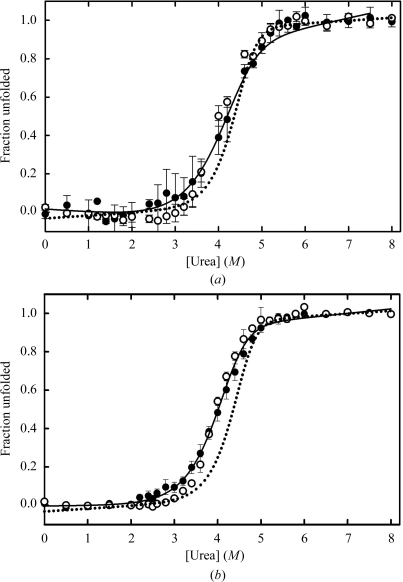
Figure 3.
Urea-induced unfolding transitions for (a) I71A and (b) I71V hGSTA1-1 determined by circular dichroism at 222 nm (filled circles) and tryptophan fluorescence (open circles). The unfolding transition for wild-type hGSTA1-1 (Wallace et al., 1998 ▶) is shown by the dotted curves in (a) and (b). The protein concentration was 2 µM in 20 mM sodium phosphate buffer pH 6.5, 1 mM EDTA, 0.02% sodium azide. The solid lines are the global regression fits to a two-state N2↔2U model.

