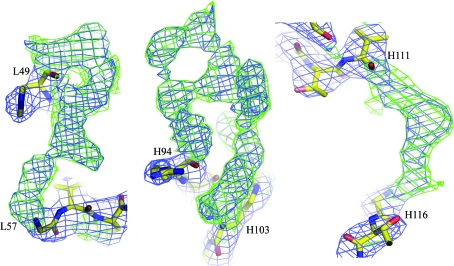
Figure 4.
Representative electron densities for residues which were not included in map calculation, showing the densities for L50–L56 (L chain CDR2, left), H95–H102 (H chain CDR3, middle) and H112–H115 (linker between CH and VH, right). The 2F o − F c map is shown in blue and is contoured at 1.5σ. The F o − F c difference map is shown in green and is contoured at 2.0σ. Figures were prepared using PyMOL (DeLano, 2002 ▶).

