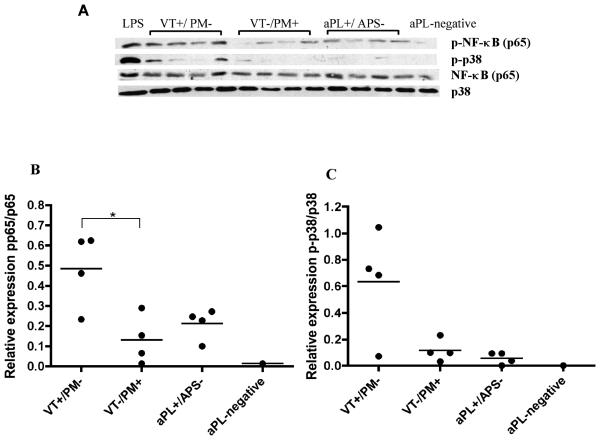
Figure 4. IgG from individual patients display similar pattern of activation of p38MAPK and NFκB on ex vivo monocytes.
Western blot analysis of cell lysates from healthy monocytes treated with IgG (100μg/ml) or LPS (3μg/ml) for 6 hours. (A) Representative blot with antibodies specific for human phosphorylated and total proteins against NFκB p65 and p38MAPK. The positive control (LPS) in lane 1 shows stimulation of p38MAPK and NFκB p65. Four individual patients from the VT+/PM− group are shown in lanes 2-5, four individual patients from the VT−/PM+ group are shown in lanes 6-9, four individual patients from the aPL+/APS− group are shown in lanes 10-13 and a pooled IgG sample from four healthy controls (aPL-negative) is shown in lane 14. (B) Quantitative densitometric analysis of the blots shown in (A) displaying ratio of phosphorylated to total protein against NFκB and (C) Quantitative densitometric analysis of the blots shown in (A) displaying ratio of phosphorylated to total p38MAPK. Statistically significant differences are shown (*p<0.05).

