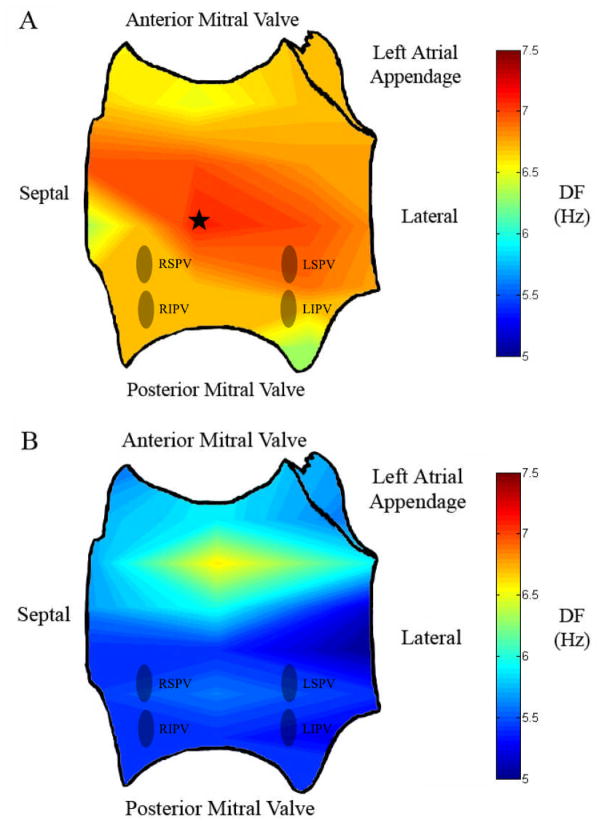
Figure 6.
Left Atrial (LA) activation Rate Maps for Study Patients in Whom AF Terminated with Ablation. (A) Potential driver site (at star) in a patient with paroxysmal atrial fibrillation. Note the relatively gradual decrease in dominant frequency (DF) over a smaller range (7.1 Hz at maximum LA DF to a minimum of 6.3 Hz). (B) Potential driver site in a patient with persistent AF showing a greater gradient in LA DF (6.6 maximum to a minimum of 5.0). Interestingly, this patient had been treated with amiodarone (stopped 5 weeks prior to ablation), possibly explaining a relatively low average DF (as shown by the greater proportion of yellow/blue areas). RSPV = right superior pulmonary vein, RIPV = right inferior pulmonary vein, LSPV = left superior pulmonary vein, LIPV = left inferior pulmonary vein, DF = dominant frequency.

