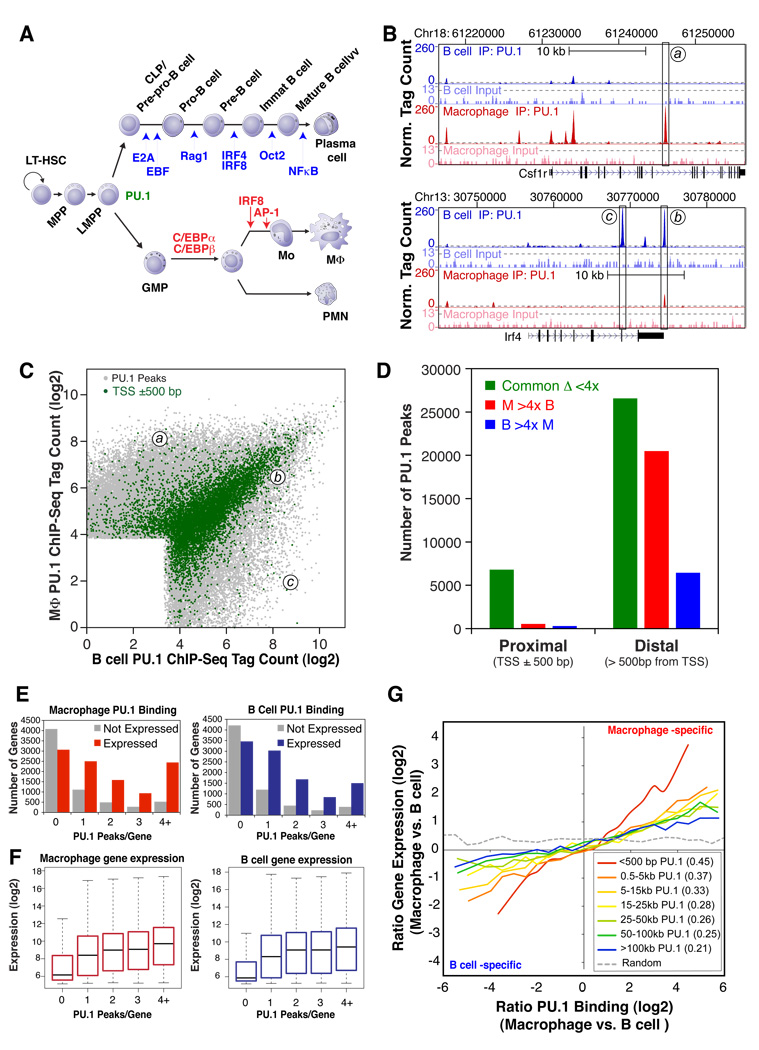
Figure 1. Identification and functional analysis of PU.1 binding sites in primary macrophages and splenic B cells.
(A) Simplified scheme for macrophage and B cell differentiation from hematopoietic stem cells, indicating genetically defined factors specific for B cells (blue) and macrophages (red) at the developmental transitions most severely affected by loss of a given factor. (B) UCSC Genome Browser image depicting PU.1 ChIP-Seq tags at the macrophage-specific Csf1r gene or the B cell-specific Irf4 gene. Dashed gray lines indicate an estimated 0.1% false discovery rate (FDR). Input DNA signal is shown 10-fold magnified. (C) PU.1-bound genomic sites are visualized by their respective normalized PU.1 ChIP-Seq tag counts (log2) within 200 bp of a given peak in macrophages and B cells. The coordinates of peaks a, b and c from panel 1B are indicated. Peak positions within 500 bp of a Refseq transcription start site are colored green. Jitter was added to the normalized tag counts to visualize otherwise overlapping data points. (D) Total number of common and cell-type specific PU.1-bound regions found in both promoter-proximal and distal genomic regions. Cell type-specificity was assigned to regions with 4-fold greater normalized tag counts in one cell type relative to the other. (E) Total number of genes with the specified number of PU.1 binding sites near their promoters. Genes were divided into subgroups of expressed and non-expressed genes based on their absolute normalized expression levels as measured by microarray hybridization (threshold: log2(microarray signal) = 6.5). (F) Distribution of the gene expression values for the combined subgroups of genes in the vicinity of the given number of peaks depicted in 1E. (G) Relationship between differential PU.1 binding and differential gene expression between macrophages and B cells. Subsets of PU.1 binding sites defined by their distance to the nearest TSS were sorted according to their difference in normalized tag counts between cell types. The moving average of the difference in gene expression values of the gene with the nearest TSS is reported relative to differential binding. The Pearson’s correlation coefficient for each group is reported in the insert (all p-values < 10−100).

