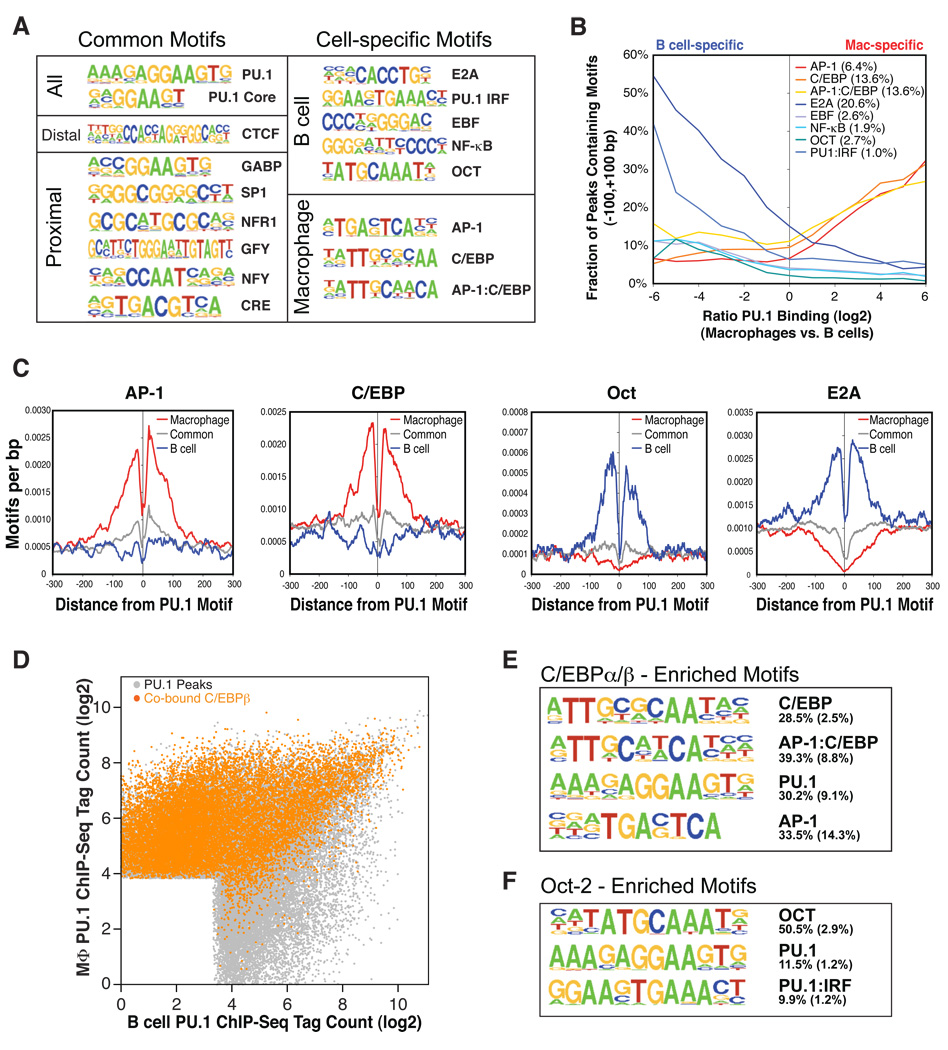
Figure 2. Transcription factors co-localize with PU.1 binding sites in macrophages and B cells.
(A) Sequence logos corresponding to enriched sequence elements identified by de novo motif analysis of promoter-proximal or inter-/intragenic PU.1 binding sites. Motifs at PU.1 sites common to macrophages and B cells were identified by comparing common peaks to randomly selected genomic regions. Motifs enriched at PU.1 sites specific to macrophages or B cells were discovered by directly comparing the sets of peaks that were exclusive to each cell type. Motif frequencies in different subsets of PU.1 peak regions are reported in Table S2. All motifs are enriched over background with p values < 10−100. (B) Frequencies of discovered motifs in PU.1 peaks (±100 bp) as a function of differential binding of PU.1 in macrophages and B cells. Expected motif frequencies based on 100k random genomic regions are reported in the legend. (C) Context-specific frequencies of AP-1, C/EBP, OCT, and E2A motifs in the vicinity of the central PU.1 motif found in PU.1 binding sites. Moving averages of motif frequencies within a 23 bp window are centered on distal macrophage-specific PU.1 sites (red), distal B cell-specific PU.1 binding sites (blue), and common distal PU.1 binding sites (gray) (>500 bp from the nearest TSS). (D) Differential PU.1 occupancy of PU.1 peaks as in Figure 1C; PU.1 peaks are colored orange if a C/EBPβ peak is located within 100 bp of the PU.1 peak. (E and F) Sequence logos are shown for the most highly enriched sequence motifs in C/EBPβ and Oct-2 binding sites, respectively. The fraction of peaks containing at least one instance of each motif within 100 bp of the peak center is given to the right of the motif with the expected frequency of the motif in 50k random regions given in parentheses.

