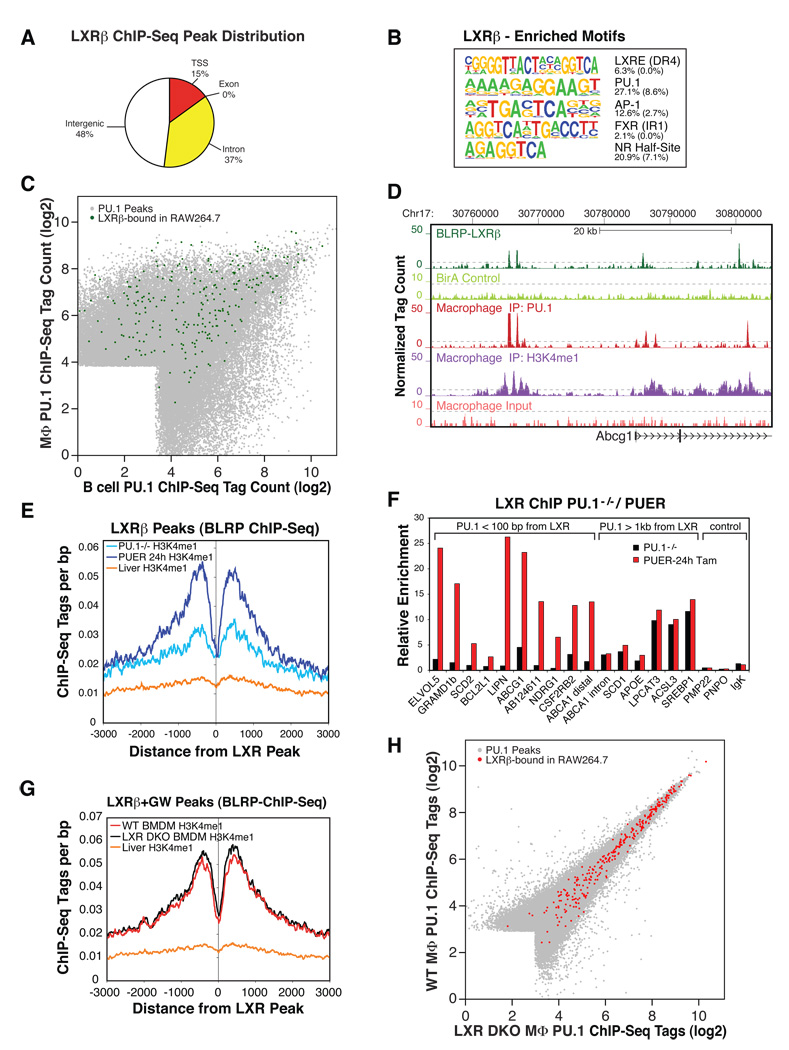
Figure 5. PU.1 establishes part of the LXRβ cistrome and H3K4me1 pattern around LXRβ binding sites in macrophages, but not vice versa.
(A) Genomic annotation of high confidence LXRβ binding sites defined by ChIP-Seq of biotin-tagged LXRβ in RAW264.7 murine macrophages. (B) De novo motif analysis of LXR-bound regions in macrophages. The fraction of peaks containing at least one instance of each motif within 100 bp of the peak center is given to the right of the motif with the expected frequency of the motif in random regions in parentheses. (C) Macrophage and B cell PU.1 binding as in Figure 1C; PU.1 peak positions are colored green if an LXRβ peak is located within 100 bp of a PU.1 peak. (D) UCSC browser image of the LXR target gene locus ABCG1 depicting coordinate binding of LXR and PU.1, together with the associated H3K4me1 signature. The 2.5-fold magnified BirA control track denotes sequencing of a pulldown from formaldehyde-fixed, BirAtransgenic RAW264.7 devoid of BLRP-tagged proteins. (E) Cumulative H3K4me1 levels in PU.1−/− myeloid progenitors (PU.1−/−), PUER cells treated for 24 h with tamoxifen (PUER 24 h) or mouse liver as control (liver H3K4me1 ChIP-Seq data from (Robertson et al., 2008)) around LXRβ peak positions defined in RAW264.7 macrophages. (F) LXR binding at the indicated loci in PU.1−/− cells vs. PUER cells treated with tamoxifen for 24 h as compared by ChIP-qPCR. Values represent fold enrichment over ChIP with IgG control antibody. (G) Cumulative H3K4me1 levels in bone marrow macrophages derived from LXRα−/−/ LXRβ−/−mice (LXR DKO BMDM), wild type mice (WT BMDM) or liver (Robertson et al., 2008) as non-macrophage control, around LXRβ peak positions defined in RAW264.7 macrophages. (H) Scatter plot depicting PU.1 ChIP-Seq tag counts (log2) within 200 bp of combined genomic PU.1 peak positions defined in bone marrow-derived macrophages from wild type mice (WT MФ) or LXRα−/−/ LXRβ−/− mice (LXR DKO MФ). Genomic PU.1 peaks within 100 bp of an LXRβ peak in RAW264.7 macrophages are colored red.

