Fig. 3.
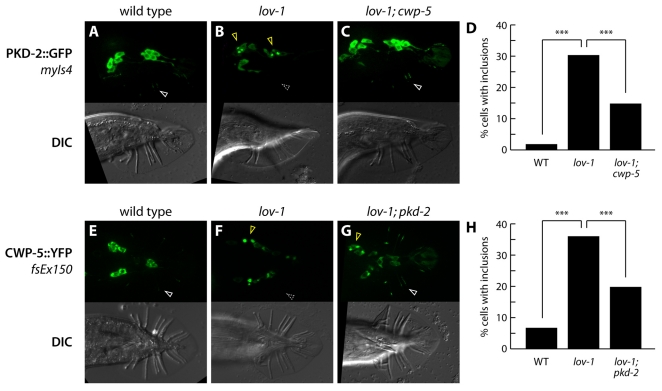
Protein trafficking in cwp-5 and polycystin mutants. (A–C) Panels show fluorescence (above) and DIC (below) of young adult males of the indicated genotypes carrying the PKD-2::GFP fusion protein transgene myIs4 (Bae et al., 2006). White arrowheads indicate the localization of PKD-2::GFP to RnB cilia; the dashed gray arrowhead indicates the absence of ray cilium localization. Yellow arrowheads indicate aberrant perinuclear inclusions of PKD-2::GFP. (D) Quantitation of perinuclear inclusions of PKD-2::GFP in animals of the indicated genotypes. Individual cells were scored for the presence or absence of intense cytoplasmic inclusions by epifluorescence microscopy. In wild-type animals, 173 cells in 13 animals were scored; in lov-1 mutants, 285 cells in 23 animals were scored; in lov-1; cwp-5 mutants, 272 cells in 24 animals were scored. Statistical comparisons were made using Fisher’s exact test. Asterisks (***) indicate P<10−4. (E–G) Panels show fluorescence (above) and DIC (below) of young adult males of the indicated genotypes carrying the CWP-5::YFP fusion protein transgene fsEx150. White arrowheads indicate the localization of CWP-5::YFP to RnB cilia; the dashed gray arrowhead indicates the absence of ray cilium localization. Yellow arrowheads indicate aberrant perinuclear inclusions of CWP-5::YFP. (H) Quantitation of perinuclear inclusions of CWP-5::YFP in animals of the indicated genotypes. Individual cells were scored for the presence or absence of intense cytoplasmic inclusions by epifluorescence microscopy. In wild-type animals, 121 cells in 13 animals were scored; in lov-1 mutants, 393 cells in 32 animals were scored; in lov-1; pkd-2 mutants, 30 cells in 24 animals were scored. Statistical comparisons were made using Fisher’s exact test. Asterisks (***) indicate P<10−4.

