
Fig. 1.
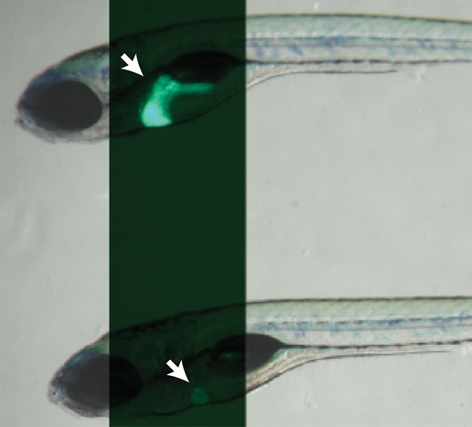
oliver mutants show a liver-specific phenotype. (A) Bright-field images of 6-dpf Tg(–2.8fabp10:EGFP)as3WT (top) and olis469 mutant (bottom) larvae combined with fluorescence to reveal their liver (arrows). By 6 dpf, and compared with their WT siblings, olis469 mutants (bottom) exhibit an o-shaped liver of reduced size (arrow) in an otherwise phenotypically WT body. (B,C) Confocal images of 5-dpf Tg(–2.8fabp10:EGFP)as3WT (B) and olis469 mutant (C) livers stained with phalloidin (red) and TO-PRO (blue). EGFP expression (green) in hepatocytes reveals a well-organized structure in the WT liver, contrasting with the disarray observed in olis469 mutants. (D,E) Confocal images of 5-dpf Tg(fabp10:RFP)gz12WT (D) and olis469 mutant (E) livers stained for cadherin (green) and TO-PRO (blue). The cells surrounded by the few hepatocytes (red) that are detected in olis469 mutant livers express cadherin (green) at levels that, at this stage in WT livers, are characteristic of cells of the intrahepatic biliary tree (D, arrows). Bars, 20 μm.